Phytoplankton samples were collected on October 15, 2025 at Bullock’s Reach and analyzed in the laboratory shortly after collection.
It was sunny and windy on this day. The water temperature was 16.13 °C and the salinity was 26.53 psu.
The qualitative tow net sample had a short to moderate filtration time. The filtrate was light tan and contained some dark precipitates.
The analysis of the quantitative whole water sample revealed a total of 69,000 cells/L. The microflagellates were found at 30,000 cells/L. The most predominant phytoplankton genera were Chaetoceros spp. at 31,000 cells/L, Prorocentrum spp. at 3,000 cells/L, and pennate diatoms at 3,000 cells/L.
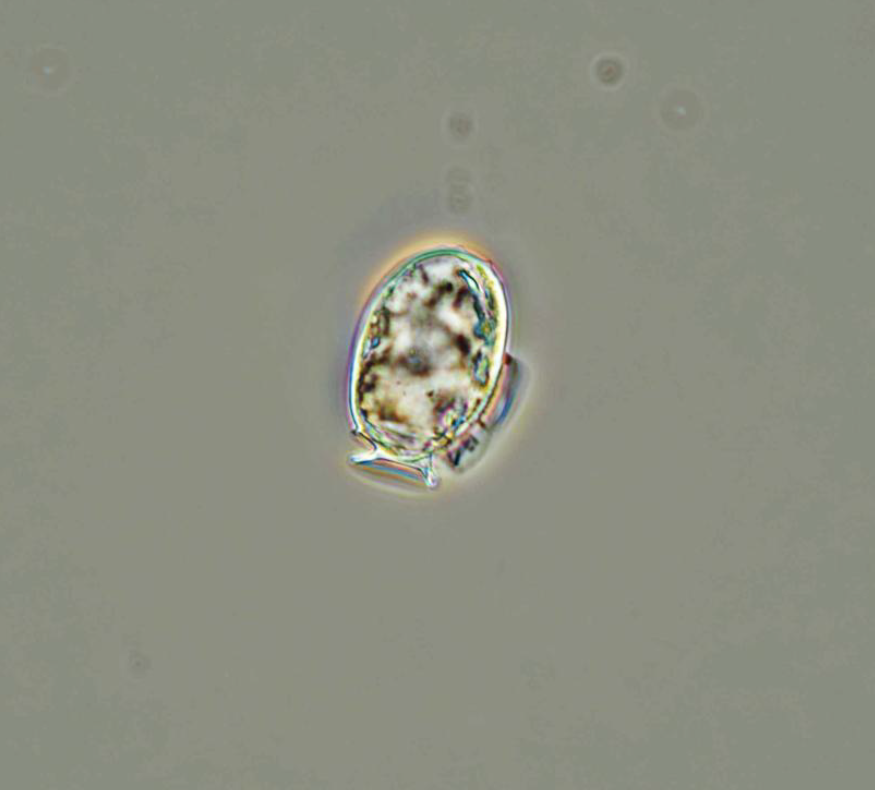
400x phase contrast image of Dinophysis acuminata
Dinophysis acuminata is a marine phytoplankton species of dinoflagellates that is found in the coastal waters of Rhode Island and north Atlantic waters. This is one of several phototrophic species that are classed as toxic, as they produce okadaic acid which can cause diarrhetic shellfish poisoning (DSP).
Nutrient samples were collected from thirteen river stations on October 29th. In the five days prior to sampling, trace amounts of precipitation were recorded at T.F. Green.
Among the river stations sampled, the highest total nitrogen (TN), total dissolved nitrogen (TDN), and dissolved inorganic nitrogen (DIN) were observed at Ten Mile River @ Central Ave. (TN = 2,710 ppb, TDN = 2,720 ppb, DIN = 2,640.0 ppb). The lowest TN was observed at Moshassuck River @ Footbridge at Mill St. (590 ppb). The lowest TDN was observed at Palmer River @ Rt. 6 (691 ppb). The lowest DIN was observed at Coles River @ Milford Rd. (101.4 ppb).
The next scheduled sampling date is November 13th, 2025.
Nutrient samples were collected from seven river stations and seven bay stations on October 15th. All bay stations were sampled at the surface and bottom. In the five days prior to sampling, 2.41” of precipitation were recorded at T.F. Green.
Among the river stations sampled, the highest total nitrogen (TN), total dissolved nitrogen (TDN), and dissolved inorganic nitrogen (DIN) were observed at Blackstone River @ Bikepath Bridge (TN = 1,390 ppb, TDN = 1,390 ppb, DIN = 971.9 ppb). The lowest TN, TDN, and DIN were observed at Moshassuck River @ Footbridge at Mill St. (TN = 577 ppb, TDN = 542 ppb, DIN = 310.8 ppb).
Among the bay stations sampled, the highest surface total nitrogen (TN) and dissolved inorganic nitrogen (DIN) were observed at Phillipsdale Landing (TN = 1,320 ppb, DIN = 833.0 ppb). The highest surface total dissolved nitrogen (TDN) was observed at Pawtuxet Cove (1770 ppb). The lowest surface TN, TDN, and DIN were observed at Bullock Reach (TN = 642 ppb, TDN = 522 ppb, DIN = 245 ppb).
The next scheduled sampling date is October 29th, 2025.
Nutrient samples were collected from thirteen river stations and eight bay stations on October 1st. In the five days prior to sampling, 0.06” of precipitation were recorded at T.F. Green.
Among the river stations sampled, the highest total nitrogen (TN), total dissolved nitrogen (TDN), and dissolved inorganic nitrogen (DIN) were observed at Ten Mile River @ Central Ave. (TN = 1,860 ppb, TDN = 1,830 ppb, DIN = 1,516.0 ppb). The lowest TN was observed at Coles River @ Milford Rd. (661 ppb). The lowest TDN was observed at Taunton River @ Berkley Bridge (385 ppb). The lowest DIN was observed at Taunton River @ River Rd. (119.9 ppb).
Among the bay stations sampled, the highest surface total nitrogen (TN), total dissolved nitrogen (TDN), and dissolved inorganic nitrogen (DIN) were observed at Phillipsdale Landing (TN = 967 ppb, TDN = 737 ppb, DIN = 415.0 ppb). The lowest surface total nitrogen (TN), total dissolved nitrogen (TDN), and dissolved inorganic nitrogen (DIN) were observed at Pomham Rocks (TN = 556 ppb, TDN = 363 ppb, DIN = 149.9 ppb).
The next scheduled sampling date is October 15th, 2025.
On November 19th, 2025, twenty stations were sampled for fecal coliform bacteria in the Providence and Seekonk Rivers; five of these stations were also sampled for enterococci bacteria. In the five days prior to sampling, 0.77 inches of precipitation was recorded at TF Green. Overall, bacteria counts were lower than during the previous sampling event.
Fecal coliform counts were higher in the Seekonk River, compared to the Providence River (geometric mean of 31 MPN/100 mL for the Seekonk River compared to 22 MPN/100mL for the Providence River) for sampling conducted on November 19th. The maximum count (430 MPN/100 mL) was measured at the Point Street Bridge sampling location.
Fecal coliform counts were lower in the Providence River, compared to the previous sampling on November 5th (geometric mean of 22 MPN/100 mL compared to 63 MPN/100 mL on 11/5). Fecal coliform counts were lower in the Seekonk River, compared to the previous sampling on November 5th (geometric mean of 31 MPN/100 mL compared to 196 MPN/100 mL on 11/5).
Enterococci results had an overall geometric mean of 16 MPN/100 mL. Enterococci counts ranged from <10 MPN/100 mL at South FP East and Conimicut Point to 61 MPN/100 mL at Point Street Bridge.
The next scheduled sampling date is December 3rd.
The table below lists the Rhode Island bacteria standards for primary contact and shellfishing established by the Rhode Island Department of Environmental Management (RIDEM). RIDEM defines primary contact as any recreational activities in which there is prolonged and intimate contact with water, involving considerable risk of ingesting water (e.g., swimming, diving, water skiing and surfing). Please note that the RIDEM bacteria standards are provided here for informational purposes only and are not intended to indicate official state compliance with primary contact or shellfishing standards.
Summary of Rhode Island Bacteria Standards for Saltwater Primary Contact and Shellfishing
Geometric mean ≤35 colonies/100 mL All samples ≤104 colonies/100 mL2
Shellfishing
Geometric mean ≤14 MPN/100 mL <10% of samples >49 MPN/100 mL3
NO ENTEROCOCCI CRITERIA
1Fecal coliform primary contact criteria applied only when adequate enterococci data are not available; 2Single sample maximum criterion for determining beach swimming advisories at designated beaches as evaluated by the Rhode Island Department of Health; 3For a three-tube decimal dilution.
On November 5th, 2025, twenty stations were sampled for fecal coliform bacteria in the Providence and Seekonk Rivers; five of these stations were also sampled for enterococci bacteria. In the five days prior to sampling, 0.12 inches of precipitation was recorded at TF Green. Overall, bacteria counts were higher than during the previous sampling event.
Fecal coliform counts were higher in the Seekonk River, compared to the Providence River (geometric mean of 196 MPN/100 mL for the Seekonk River compared to 63 MPN/100mL for the Providence River) for sampling conducted on November 5th. The maximum count (1,500 MPN/100 mL) was measured at the Point Street Bridge sampling location.
Fecal coliform counts were higher than during the previous sampling event, though note that was over a month prior (September 10th).
Enterococci results had an overall geometric mean of 18 MPN/100 mL. Enterococci counts ranged from <10 MPN/100 mL at Gaspee Point and Conimicut Point to 85 MPN/100 mL at Point Street Bridge.
The next scheduled sampling date is November 19th.
The table below lists the Rhode Island bacteria standards for primary contact and shellfishing established by the Rhode Island Department of Environmental Management (RIDEM). RIDEM defines primary contact as any recreational activities in which there is prolonged and intimate contact with water, involving considerable risk of ingesting water (e.g., swimming, diving, water skiing and surfing). Please note that the RIDEM bacteria standards are provided here for informational purposes only and are not intended to indicate official state compliance with primary contact or shellfishing standards.
Summary of Rhode Island Bacteria Standards for Saltwater Primary Contact and Shellfishing
Geometric mean ≤35 colonies/100 mL All samples ≤104 colonies/100 mL2
Shellfishing
Geometric mean ≤14 MPN/100 mL <10% of samples >49 MPN/100 mL3
NO ENTEROCOCCI CRITERIA
1Fecal coliform primary contact criteria applied only when adequate enterococci data are not available; 2Single sample maximum criterion for determining beach swimming advisories at designated beaches as evaluated by the Rhode Island Department of Health; 3For a three-tube decimal dilution.
Nutrient samples were collected from six river stations and seven bay stations on September 17th. All bay stations were sampled at the surface and bottom. In the five days prior to sampling, no precipitation was recorded at T.F. Green.
Among the river stations sampled, the highest total nitrogen (TN), total dissolved nitrogen (TDN), and dissolved inorganic nitrogen (DIN) were observed at Ten Mile River @ Central Ave. (TN = 2,250 ppb, TDN = 2,410 ppb, DIN = 1,946.0 ppb). The lowest TN were observed at Runnins River @ River Rd. (486 ppb). The lowest TDN, and DIN were observed at Palmer River @ Rt. 6 (TDN = 327 ppb, DIN = 24.2 ppb).
Among the bay stations sampled, the highest surface total nitrogen (TN), total dissolved nitrogen (TDN), and dissolved inorganic nitrogen (DIN) were observed at Pawtuxet Cove (TN = 1,140 ppb, TDN = 892 ppb, DIN = 577.4 ppb). The lowest surface TN and TDN were observed at Conimicut Point (TN = 492 ppb, TDN = 210 ppb). The lowest surface DIN was observed at Bullock Reach (35.51 ppb). The highest concentration of chlorophyll a was observed at Pawtuxet Cove (25.664 ug/L).
The next scheduled sampling date is October 1st, 2025.
Phytoplankton samples were collected on October 1, 2025 at Bullock’s Reach and analyzed in the laboratory shortly after collection.
It was sunny and breezy on this day. The water temperature was 20.14 °C, the salinity was 30.14 psu, and the chlorophyll a was 4.28 ug/L.
The qualitative tow net sample had a short to moderate filtration time. The filtrate was dark brown and contained some jellyfish.
The analysis of the quantitative whole water sample revealed a total of 509,000 cells/L. The microflagellates were found at 197,000 cells/L. The most predominant phytoplankton genera were Cerataulina spp. at 85,000 cells/L, Chaetoceros spp. at 65,000 cells/L, and Ditylum spp. at 32,000 cells/L.
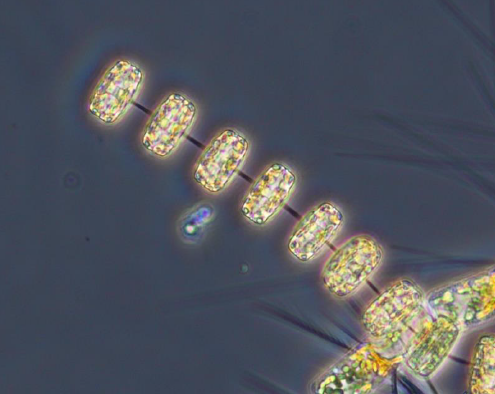
200x phase contrast image of Thalassiosira spp.
Thalassiosira is a genus of centric diatoms that are vital primary producers in temperate and polar seas. They can thrive in low temperature and light, as well as mixed waters, which allows them to play a large part in spring diatom blooms. They are also able to defend themselves against zooplankton, allowing them to survive the predation that normally keeps phytoplankton blooms in check.
Overall, the water quality at Phillipsdale Landing was fair this week. Weather conditions were dry, with no precipitation recorded at T.F. Green. The Blackstone River flow fluctuated throughout the week. Surface salinity averaged 18.3 ppt and ranged from 6.8 ppt to 26.1 ppt. At the bottom, salinity averaged 25.1 ppt and ranged from 14.7 ppt to 28.7 ppt. Surface temperature increased this week, averaging 24.2°C at the surface and ranging 22.5°C – 26.5°C. The bottom temperature increased averaged 23.2°C and ranged 21.9°C – 25.0°C.
Dissolved oxygen (DO) at Phillipsdale Landing dropped below the hypoxia threshold (i.e., DO >2.9 mg/L) throughout the week. The longest periods of hypoxic conditions spanned 21.75 hours, occurring at the bottom depth from the afternoon of August 6th until the morning of August 7th. During this period, the bottom DO averaged around 1.69 mg/L. Surface DO averaged 9.1 mg/L and ranged from 1.9 mg/L to 22.2 mg/L. Bottom DO concentrations averaged 3.4 mg/L and ranged from 0.0 mg/L to 12.0 mg/L. Chlorophyll readings increased from last week, averaging 30.1 µg/L at the surface and 33.1 µg/L at the bottom. Maximum chlorophyll at the surface reached 349.2 µg/L on the morning of August 5th. Please note that tidal fluctuations and Blackstone River flows greatly influence water column salinity, temperature, and DO at this location.
Bullock Reach
Sondes were swapped this week on the morning of August 5th. Overall, water quality was good to fair at Bullock Reach this week. Salinity averaged 27.8 ppt, 29.6 ppt, and 31.1 ppt at the surface, middle, and bottom sondes, respectively. Surface salinity ranged 24.3– 29.6 ppt, mid salinity ranged 27.5 – 30.9 ppt, and bottom salinity ranged 29.5 – 32.1 ppt. Surface temperature averaged 23.6°C and ranged from 22.5°C to 25.0°C. Mid temperatures averaged 22.9°C and ranged from 21.0°C to 24.0°C. Bottom temperatures averaged 21.1°C and ranged from 19.7°C to 23.3°C.
Dissolved oxygen (DO) at Bullock Reach remained above the hypoxia threshold (i.e., DO >2.9 mg/L) at the surface and middle depths throughout the week, while DO at the bottom waters dropped below the hypoxic threshold at the start of the week. Surface DO averaged 8.3 mg/L and ranged 5.9 – 11.9 mg/L. In the mid waters, DO averaged 6.2 mg/L and ranged 3.1 – 8.8 mg/L. At the bottom, DO averaged 3.4 mg/L and ranged 1.9 – 6.8 mg/L. Chlorophyll readings ranged from low to elevated throughout the week. Readings averaged 14.4 µg/L at the surface, 9.8 µg/L at mid-depth, and 4.4 µg/L at the bottom. The maximum surface chlorophyll was 33.4 µg/L on the afternoon of August 5th.
Sondes were swapped this week on the morning of July 29th. Overall, the water quality at Phillipsdale Landing was fair this week. Weather conditions included frequent rain events this week, with 0.74 inches of precipitation recorded at T.F. Green. The Blackstone River flow fluctuated throughout the week. Surface salinity averaged 18.0 ppt and ranged from 6.2 ppt to 23.4 ppt. At the bottom, salinity averaged 24.7 ppt and ranged from 11.1 ppt to 29.4 ppt. Temperatures averaged 25.3°C at the surface and 24.1°C at the bottom. Surface temperatures ranged from 22.6°C to 29.8°C, while bottom temperatures ranged from 21.9°C to 26.4°C.
Dissolved oxygen (DO) at Phillipsdale Landing dropped below the hypoxia threshold (i.e., DO >2.9 mg/L) throughout the week. The longest periods of hypoxic conditions spanned 10.0 hours, occurring during the morning of July 28th. During this period, the bottom DO averaged around 1.98 mg/L. Surface DO averaged 8.3 mg/L and ranged from 1.8 mg/L to 20.7 mg/L. Bottom DO concentrations averaged 3.0 mg/L and ranged from 0.0 mg/L to 13.3 mg/L. Chlorophyll readings decreased from last week, averaging 24.2 µg/L at the surface and 27.5 µg/L at the bottom. Maximum chlorophyll reached 326.4 µg/L in the bottom waters during the afternoon of August 3rd. Please note that tidal fluctuations and Blackstone River flows greatly influence water column salinity, temperature, and DO at this location.
Bullock Reach
Overall, water quality was good to fair at Bullock Reach this week. Salinity averaged 27.4 ppt, and 29.1 ppt at the surface, and bottom sondes, respectively. Surface salinity ranged 25.3– 29.4 ppt, middle salinity ranged 26.9 – 31.4 ppt, and bottom salinity ranged 29.5 – 32.7 ppt. Surface temperature averaged 24.6°C and ranged from 21.8°C to 27.6°C. Middle temperatures averaged 23.8°C and ranged from 20.9 – 26.7°C. Bottom temperatures averaged 21.5°C and ranged from 19.3°C to 23.8°C.
Dissolved oxygen (DO) at Bullock Reach remained above the hypoxia threshold (i.e., DO >2.9 mg/L) at the surface throughout the week, while DO at the middle and bottom waters dropped below the hypoxic threshold at the start of the week. Surface DO averaged 7.6 mg/L and ranged 4.9 – 11.0 mg/L. At the middle, DO averaged 5.5 mg/L and ranged 2.8 – 9.3 mg/L. At the bottom, DO averaged 4.2 mg/L and ranged 2.8 – 5.3 mg/L. Chlorophyll readings ranged from low to elevated throughout the week. Readings averaged 11.9 µg/L at the surface, 15.5 µg/L at the middle, and 5.7 µg/L at the bottom. The maximum surface chlorophyll was 41.8 µg/L on the afternoon of July 29th.