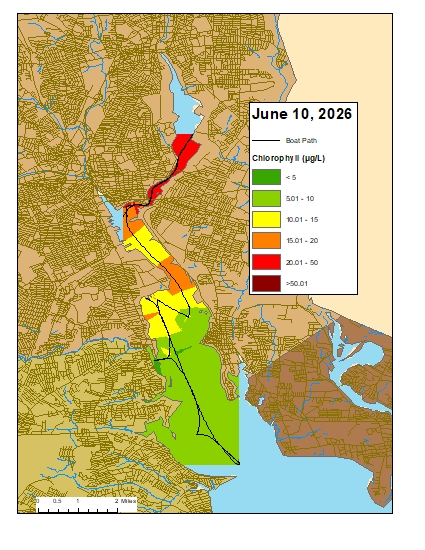
Surface chlorophyll data were collected on May 20, 2026, while the R/V Data Stream was underway collecting bacteria samples in the Providence and Seekonk River Estuaries. The average chlorophyll concentrations were categorized as fair in all areas. The average chlorophyll concentrations were also categorized as fair over all areas surveyed. Overall, chlorophyll ranged from 0.97 µg/L to 120.89 µg/L with an average of 6.97 µg/L. The chlorophyll concentrations from this date are presented in the map below using Inverse Distance Weighting (IDW) interpolation.
Surface chlorophyll data were collected on May 7, 2026, while the R/V Data Stream was underway collecting bacteria samples in the Providence and Seekonk River Estuaries. The average chlorophyll concentrations were categorized as good in all areas. The average chlorophyll concentrations were categorized as good to fair over all areas surveyed. Overall, chlorophyll ranged from 1.60 µg/L to 13.44 µg/L with an average of 4.63 µg/L. The chlorophyll concentrations from this date are presented in the map below using Inverse Distance Weighting (IDW) interpolation.
Water clarity was measured at seven locations in the Providence River and Seekonk River estuaries on May 19, 2026. In the five days prior to the survey, 0.11 inches of precipitation were recorded at TF Green. Secchi depth averaged 2.9 meters. The lowest clarity this week (1.9 meters) was measured at Phillipsdale Landing, while the greatest clarity (3.7 meters) was measured at Bullock Reach and Conimicut Point. There was a general north-to-south trend of increasing water clarity among the sites this week. Overall, water clarity increased from the previous measurements (data collected May 12, 2026).
Water clarity was measured at eight locations in the Providence River and Seekonk River estuaries on May 12, 2026. In the five days prior to the survey, 0.57 inches of precipitation were recorded at TF Green. Secchi depth averaged 2.1 meters. The lowest clarity this week (1.9 meters) was measured at Bullock Reach and Edgewood Shoal, while the greatest clarity (2.5 meters) was measured at Pawtuxet Cove. There was no clear north-to-south gradient in water clarity among the sites this week. Overall, water clarity decreased from the previous measurements (data collected May 7, 2026).
Water clarity was measured at eight locations in the Providence River and Seekonk River estuaries on May 7, 2026. In the five days prior to the survey, 0.05 inches of precipitation were recorded at TF Green. Secchi depth averaged 3.0 meters. The lowest clarity this week (1.7 meters) was measured at Phillipsdale Landing, while the greatest clarity (4.3 meters) was measured at Conimicut Point. There was a general north-to-south trend of increasing water clarity among the sites this week.
Surface chlorophyll data were collected on April 29, 2026, while the R/V Data Stream was underway collecting nutrient samples in the Providence and Seekonk River Estuaries. The average chlorophyll concentrations were categorized as good in all areas. The average chlorophyll concentrations were categorized as good to fair over all areas surveyed. Overall, chlorophyll ranged from 1.50 µg/L to 14.60 µg/L with an average of 4.50 µg/L. The chlorophyll concentrations from this date are presented in the map below using Inverse Distance Weighting (IDW) interpolation.
Surface chlorophyll data were collected on April 29, 2026, while the R/V Data Stream was underway collecting bacteria samples in the Providence and Seekonk River Estuaries. The average chlorophyll concentrations were categorized as good in all areas. The average chlorophyll concentrations were also categorized as good over all areas surveyed. Overall, chlorophyll ranged from 1.09 µg/L to 3.94 µg/L with an average of 1.96 µg/L. The chlorophyll concentrations from this date are presented in the map below using Inverse Distance Weighting (IDW) interpolation.
Surface chlorophyll data were collected on April 15, 2026, while the R/V Data Stream was underway collecting nutrient samples in the Providence and Seekonk River Estuaries. The average chlorophyll concentrations were categorized as fair in all areas. The average chlorophyll concentrations were also categorized as fair over all areas surveyed. Overall, chlorophyll ranged from 1.67 µg/L to 44.92 µg/L with an average of 13.52 µg/L. The chlorophyll concentrations from this date are presented in the map below using Inverse Distance Weighting (IDW) interpolation.
On April 23rd, 2026, twenty stations were sampled for fecal coliform bacteria in the Providence and Seekonk Rivers; four of these stations were also sampled for enterococci bacteria. In the five days prior to sampling, 0.21” of precipitation was recorded at TF Green. Overall, bacteria counts were higher than during the previous sampling event.
Fecal coliform counts were higher in the Seekonk River, compared to the previous sampling on April 8th (geometric mean of 223 MPN/100 mL compared to 80 MPN/100 mL on 4/8). Fecal coliform counts were also higher in the Providence River, compared to the previous sampling on April 8th (geometric mean of 16 MPN/100 mL compared to 10 MPN/100 mL on 4/8).
Enterococci results had an overall geometric mean of 13 MPN/100 mL. Enterococci counts ranged from <10 MPN/100 mL at most sites to 20 MPN/100 mL at Phillipsdale Landing.
The next scheduled sampling date is May 6th.
Summary of Rhode Island Bacteria Standards for Saltwater Primary Contact and Shellfishing
Geometric mean ≤35 colonies/100 mL All samples ≤104 colonies/100 mL2
Shellfishing
Geometric mean ≤14 MPN/100 mL <10% of samples >49 MPN/100 mL3
NO ENTEROCOCCI CRITERIA
1Fecal coliform primary contact criteria applied only when adequate enterococci data are not available; 2Single sample maximum criterion for determining beach swimming advisories at designated beaches as evaluated by the Rhode Island Department of Health; 3For a three-tube decimal dilution.
On April 8th, 2026, twenty stations were sampled for fecal coliform bacteria in the Providence and Seekonk Rivers; four of these stations were also sampled for enterococci bacteria. In the five days prior to sampling, 0.26” of precipitation was recorded at TF Green. Overall, bacteria counts were slightly lower than during the previous sampling event.
Fecal coliform counts were similar in the Seekonk River, compared to the previous sampling on March 25th (geometric mean of 80 MPN/100 mL compared to 88 MPN/100 mL on 3/25). Fecal coliform counts were lower in the Providence River, compared to the previous sampling on March 25th (geometric mean of 10 MPN/100 mL compared to 25 MPN/100 mL on 3/25).
Enterococci results had an overall geometric mean of 13 MPN/100 mL. Enterococci counts ranged from <10 MPN/100 mL at most sites to 41 MPN/100 mL at Point St. Bridge.
The next scheduled sampling date is April 23rd.
Summary of Rhode Island Bacteria Standards for Saltwater Primary Contact and Shellfishing
Geometric mean ≤35 colonies/100 mL All samples ≤104 colonies/100 mL2
Shellfishing
Geometric mean ≤14 MPN/100 mL <10% of samples >49 MPN/100 mL3
NO ENTEROCOCCI CRITERIA
1Fecal coliform primary contact criteria applied only when adequate enterococci data are not available; 2Single sample maximum criterion for determining beach swimming advisories at designated beaches as evaluated by the Rhode Island Department of Health; 3For a three-tube decimal dilution.