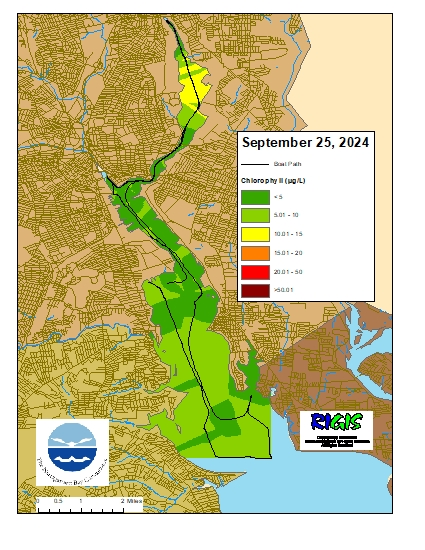
September 25, 2024
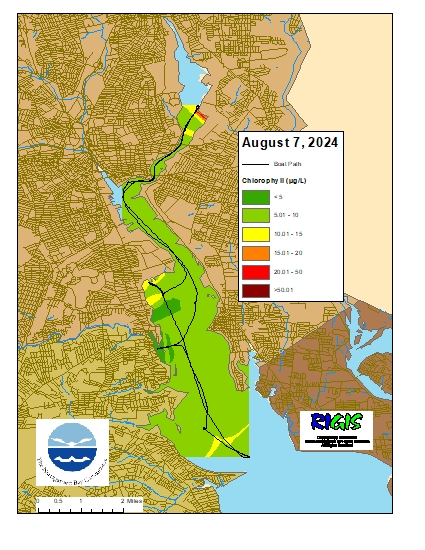
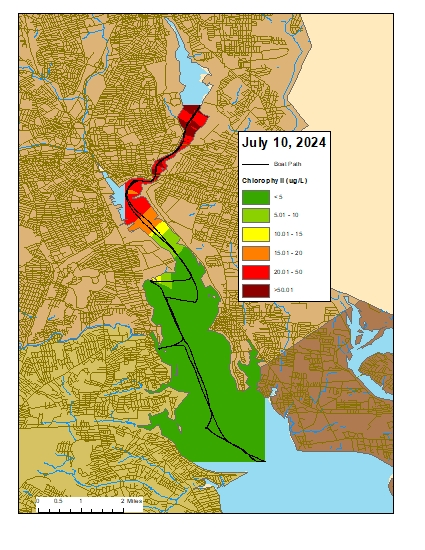
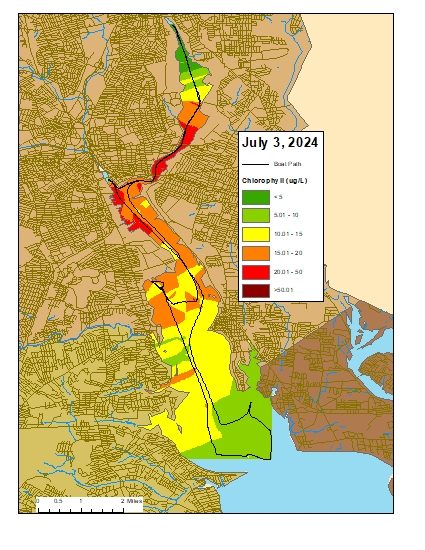
Surface chlorophyll data were collected on September 25, 2024 while the R/V Monitor was underway collecting nutrient samples in the Providence and Seekonk River estuaries. The average chlorophyll concentrations were categorized as good in the Northern Providence River Channel and Edgewood, and as fair in all other areas. Overall, chlorophyll ranged 0.99 to 15.81 µg/L with an average of 5.14 µg/L. The chlorophyll concentrations from this date are presented in the map below using Inverse Distance Weighting (IDW) interpolation.