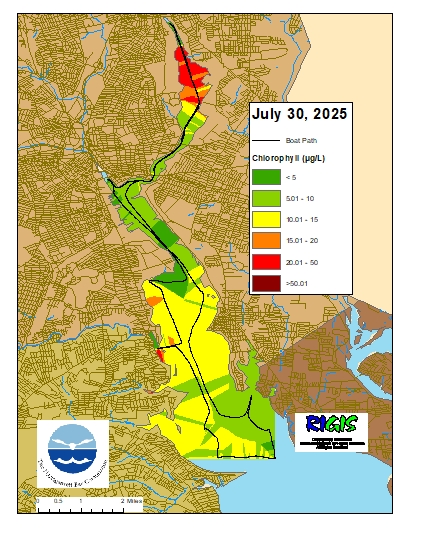
July 30, 2025
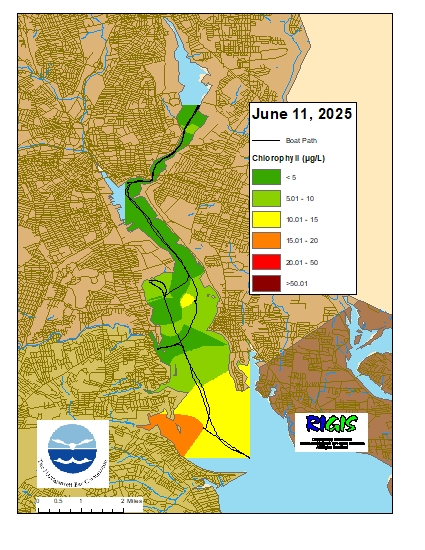
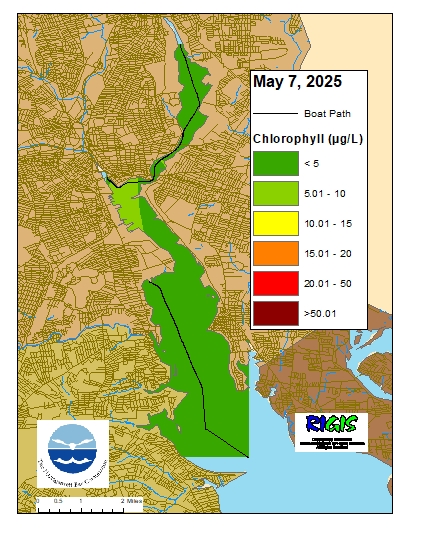
Surface chlorophyll data were collected on July 30, 2025, while the R/V Monitor was underway collecting nutrient samples in the Providence and Seekonk River estuary. The average chlorophyll concentrations were categorized as fair in all individual areas surveyed as well as in the overall survey area. Overall, chlorophyll ranged from 1.1 µg/L to 46.06 µg/L with an average of 10.06 µg/L. The chlorophyll concentrations from this date are presented in the map below using Inverse Distance Weighting (IDW) interpolation.