Nicole Skyleson

April 30, 2025

Nutrient samples were collected from seven river stations April 30th. In the five days prior to sampling, 0.76 inches of precipitation were recorded at T.F. Green. 

The highest total nitrogen (TN), total dissolved nitrogen (TDN) and dissolved inorganic nitrogen (DIN) concentrations were observed at Pawtuxet River @ Broad St. (TN = 1,120 ppb, TDN = 1,100 ppb, DIN = 875 ppb). The lowest TN, TDN and DIN concentrations were observed at Moshassuck River @ Footbridge at Mill St. (TN =670 ppb, TDN = 722 ppb, DIN = 427 ppb).

The next scheduled sampling date is May 14, 2025.

April 16-17, 2025

Nutrient samples were collected from seven river stations on April 16th and seven bay stations 17th. All bay stations were sampled at the surface and bottom except for one station (India Point Park) which was only sampled at the surface. In the five days prior to sampling, 0.80 inches of precipitation were recorded at T.F. Green. Due to a laboratory issue, some ammonia and dissolved inorganic nitrogen (DIN) results for the bay and river samples are not available. The DIN for both the bay and river stations will be based on the results available.

Among the river stations sampled, the highest total nitrogen (TN) was observed at Blackstone River @ Slater Mill (TN = 953 ppb). The highest total dissolved nitrogen (TDN) and dissolved inorganic nitrogen (DIN) was observed at Pawtuxet River @ Broad St. (TDN = 930 ppb, DIN = 673 ppb). The lowest TN and TDN were observed at Moshassuck River @ Footbridge at Mill St. (TN = 569 ppb, TDN = 517 ppb). The lowest DIN was observed at Blackstone River @ Bikepath Bridge. (DIN = 614 ppb).

Among the bay stations sampled, the highest surface total nitrogen (TN), total dissolved nitrogen (TDN), and dissolved inorganic nitrogen (DIN) were observed at Phillipsdale Landing (TN = 1,250 ppb, TDN = 975  ppb, DIN = 801 ppb). The lowest surface TN and DIN concentrations were observed at Conimicut Point (TN = 504 ppb, DIN = 79 ppb). The lowest surface TDN was observed at the Bullock Reach Buoy (TDN = 178 ppb).

The next scheduled sampling date is April 30, 2025.

April 2, 2025

Nutrient samples were collected from twelve river stations on April 2nd. In the five days prior to sampling, 0.25 inches of precipitation were recorded at T.F. Green. 

The highest total nitrogen (TN), total dissolved nitrogen (TDN), and dissolved inorganic nitrogen (DIN) were observed at Ten Mile River @ Central Ave. (TN = 2,040 ppb, TDN = 2,020 ppb, DIN = 1,731). The lowest TN, and TDN concentrations were observed at Moshassuck River @ Footbridge at Mill St. (TN = 546 ppb, TDN = 543 ppb). The lowest DIN concentration was observed at Coles River @ Milford Rd. (DIN = 160 ppb).

The next scheduled sampling date is April 16, 2025.

March 19, 2025

Nutrient samples were collected from seven river stations and eight bay stations on March 19th. All bay stations were sampled at the surface and the bottom. In the five days prior to sampling, 2.21 inches of precipitation were recorded at T.F. Green. 

Among the river stations sampled, the highest total nitrogen (TN), total dissolved nitrogen (TDN) and dissolved inorganic nitrogen (DIN) were observed at Blackstone River @ Slater Mill (TN = 1,220 ppb, TDN = 1,160, DIN = 810). The lowest TN, and TDN concentrations were observed on the Woonasquatucket River @ Manton Ave. Bridge (TN = 624 ppb, TDN = 617 ppb). The lowest DIN was observed at Moshassuck River @ Footbridge at Mill St. (DIN = 407 ppb).

Among the bay stations sampled, the highest surface total nitrogen (TN), total dissolved nitrogen (TDN), and dissolved inorganic nitrogen (DIN) were observed at Phillipsdale Landing (TN = 1,450 ppb, TDN = 1,290 ppb, DIN = 889 ppb). The lowest surface TN was observed at Pomham Rocks (TN = 766 ppb). The lowest surface TDN and DIN concentrations were observed at Conimicut Point Surface (TDN = 475 ppb, DIN = 223 ppb).

The next scheduled sampling date is April 2, 2025.

March 5, 2025

Nutrient samples were collected from six river stations on March 5th. In the five days prior to sampling, there was no precipitation recorded at T.F. Green. 

The highest total nitrogen (TN), total dissolved nitrogen (TDN) and dissolved inorganic nitrogen (DIN) concentrations were observed at Pawtuxet River @ Broad St. (TN = 1,590 ppb, TDN = 1,770 ppb, DIN = 1,533 ppb). The lowest TN, TDN, and DIN concentrations were observed on the Moshassuck River @ Footbridge at Mill St. (TN =558 ppb, TDN = 592 ppb, DIN = 441 ppb).

The next scheduled sampling date is March 19, 2025.

June 25, 2025

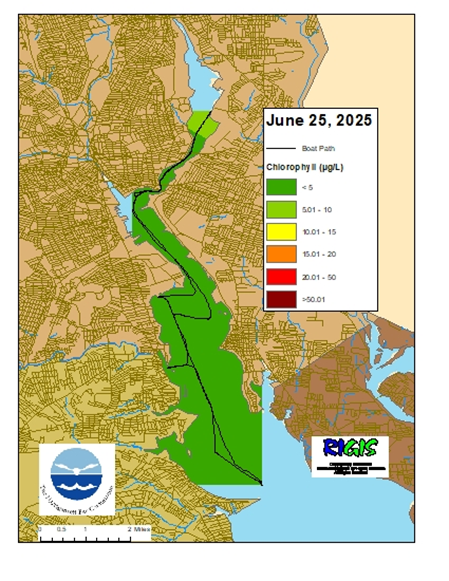
Surface chlorophyll data were collected on June 25, 2025, while the R/V Monitor was underway collecting nutrient samples in the Providence and Seekonk River estuary. The average chlorophyll concentrations were categorized as fair in the Seekonk River, and as good in all other areas. The average chlorophyll concentrations were categorized as good in all areas surveyed. Overall, chlorophyll ranged from 0.39 µg/L to 17.96 µg/L with an average of 2.01 µg/L. The chlorophyll concentrations from this date are presented in the map below using Inverse Distance Weighting (IDW) interpolation. 

June 11, 2025

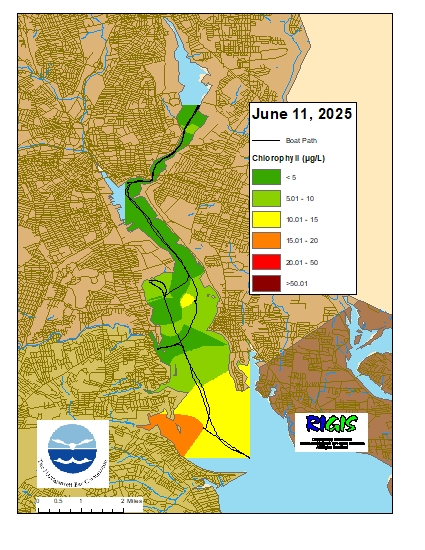
Surface chlorophyll data were collected on June 11, 2025, while the R/V Monitor was underway collecting nutrient samples in the Providence and Seekonk River estuary. The average chlorophyll concentrations were categorized as good in the Seekonk River and Pawtuxet River, and as fair in all other areas. Overall, chlorophyll ranged from 2.85 µg/L to 28.47 µg/L with an average of 19.66 µg/L. The chlorophyll concentrations from this date are presented in the map below using Inverse Distance Weighting (IDW) interpolation.

June 4, 2025

Surface chlorophyll data were collected on June 4, 2025, while the R/V Monitor was underway collecting nutrient samples in the Providence and Seekonk River estuary. The average chlorophyll concentrations were categorized as good in the Seekonk River, and as fair in all other areas. Overall, chlorophyll ranged from 1.10 µg/L to 16.10 µg/L with an average of 7.24 µg/L. The chlorophyll concentrations from this date are presented in the map below using Inverse Distance Weighting (IDW) interpolation. 

May 28, 2025

Surface chlorophyll data were collected on May 28, 2025, while the R/V Monitor was underway collecting nutrient samples in the Providence and Seekonk River estuary. The average chlorophyll concentrations were categorized as fair in the Southern Providence River, and as good in all other areas. Overall, chlorophyll ranged from 1.35 µg/L to 13.49 µg/L with an average of 5.43 µg/L. The chlorophyll concentrations from this date are presented in the map below using Inverse Distance Weighting (IDW) interpolation. 

September 16 – 22, 2024

Phillipsdale Landing

Sondes were swapped this week on the morning of September 17th.  Overall, water quality at Phillipsdale Landing was good to fair this week. Weather conditions included sporadic rain events, with 0.78 inches of precipitation recorded at T.F. Green. The Blackstone River flow remained below the 20-year daily median. Surface salinity averaged 24.3 ppt and ranged from 20.4 ppt to 28.3 ppt. At the bottom, salinity averaged 26.3 ppt and ranged from 22.9 ppt to 29.6 ppt. Temperatures continued to decline this week, averaging 21.3°C at the surface and ranging 18.5°C – 24.0°C. At the bottom, temperatures averaged 21.4°C and ranged 19.2°C – 23.5°C.

Dissolved oxygen (DO) at Phillipsdale Landing remained above the hypoxia threshold (i.e., DO >2.9 mg/L) throughout the week. Surface DO average 5.97 mg/L and ranged from 3.93 mg/L to 10.82 mg/L. Bottom DO concentrations averaged 5.0 mg/L and ranged from 3.3 mg/L to 8.5 mg/L. Chlorophyll readings decreased from last week, averaging 16.01 µg/L at the surface and 12.8 µg/L at the bottom. Maximum chlorophyll at the surface reached 57.03 µg/L on the evening of September 17th. Please note that tidal fluctuations and Blackstone River flows greatly influence water column salinity, temperature, and DO at this location. 

Bullock Reach

Overall, water quality was good to fair at Bullock Reach this week. Salinity averaged 28.7 ppt, 29.2 ppt, and 30.5 ppt at the surface, middle, and bottom sondes, respectively. Surface salinity ranged 27.5 – 29.7 ppt, mid salinity ranged 27.9 – 30.1 ppt, and bottom salinity ranged 29.0 – 31.4 ppt. Surface temperature averaged 21.0°C and ranged from 19.2°C to 23.1°C. Mid temperatures averaged 20.8°C and ranged from 19.1°C to 22.1°C. Bottom temperatures averaged 20.4°C and ranged from 19.1°C to 21.6°C.

DO at Bullock Reach remained above the hypoxia threshold (i.e., DO >2.9 mg/L) throughout the week Surface DO averaged 6.7 mg/L and ranged 5.5 – 10.2 mg/L. In the mid waters, DO averaged 6.1 mg/L and ranged 4.6 – 8.7 mg/L. At the bottom, DO averaged 5.6 mg/L and ranged 3.8 – 6.7 mg/L.  Chlorophyll readings ranged from low to elevated, with evidence of moderate phytoplankton blooms occurring throughout the week. Readings averaged 5.5 µg/L at the surface, 6.2 µg/L at mid-depth, and 6.7 µg/L at the bottom.  The maximum surface chlorophyll was 17.5 µg/L on the afternoon of September 16th.

Scroll to Top