Nicole Skyleson

August 12 – 18, 2024

Phillipsdale Landing

Overall, water quality at Phillipsdale Landing was fair to poor this week. Weather conditions included sporadic rain events, with 1.18 inches of precipitation recorded at T.F. Green. The Blackstone River flow fluctuated through the week in response to rain. Surface salinity averaged 16.3 ppt and ranged from 7.0 ppt to 23.5 ppt. At the bottom, salinity averaged 25.0 ppt and ranged from 14.9 ppt to 28.5 ppt. Temperatures continued to increase this week, averaging 24.4°C at the surface and ranging 22.5°C – 26.7°C. At the bottom, temperatures averaged 23.4°C and ranged 22.2°C – 24.8°C.

Dissolved oxygen (DO) at Phillipsdale Landing dropped below the hypoxia threshold (i.e., DO >2.9 mg/L) over the week. Surface DO average 8.3 mg/L and ranged from 2.0 mg/L to 21.8 mg/L. Bottom DO concentrations averaged 1.7 mg/L and ranged from 0.5 mg/L to 6.2 mg/L. The longest period of hypoxic conditions (1 day, 12 hours and 15 minutes) occurred at the bottom depth between the night of August 13th to the morning of August 15th. During this period, bottom DO averaged around 0.86 mg/L. Chlorophyll readings increased from last week, averaging 51.1 µg/L at the surface and 25.6 µg/L at the bottom. Maximum chlorophyll at the surface reached 219.8 µg/L on the afternoon of August 12th. Please note that tidal fluctuations and Blackstone River flows greatly influence water column salinity, temperature, and DO at this location. 

Bullock Reach

Sondes were swapped this week on the morning of August 15th. Overall, the water quality was good to fair at Bullock Reach this week. Salinity averaged 26.3 ppt, 28.7 ppt, and 30.8 ppt at the surface, middle, and bottom sondes, respectively. Surface salinity ranged 22.8 – 25.3 ppt, mid salinity ranged 21.8 – 24.8 ppt, and bottom salinity ranged 20.3 – 23.1 ppt. Surface temperature averaged 24.1°C and ranged from 22.8°C to 25.3°C. Mid temperatures averaged 23.1°C and ranged from 21.8°C to 24.8°C. Bottom temperatures averaged 21.4°C and ranged from 20.3°C to 23.1°C.

DO at Bullock Reach remained above the hypoxia threshold (i.e., DO >2.9 mg/L) at the surface. Middle and Bottom DO dropped below the hypoxia threshold sporadically throughout the week. Surface DO averaged 8.7 mg/L and ranged 5.6 – 13.7 mg/L. In the mid waters, DO averaged 4.6 mg/L and ranged 2.1 – 9.0 mg/L. At the bottom, DO averaged 3.0 mg/L and ranged 1.8 – 5.1 mg/L.  The longest period of hypoxic conditions (1 day, 10 hours, and 45 minutes) occurred at the bottom depth during the night of August 16th until the morning of August 18th.  During this period, bottom DO averaged around 2.29 mg/L. Chlorophyll readings ranged from low to elevated, with evidence of moderate phytoplankton blooms occurring throughout the week. Readings averaged 20.1 µg/L at the surface, 13.4 µg/L at mid-depth, and 4.1 µg/L at the bottom.  The maximum surface chlorophyll was 54.5 µg/L on the afternoon of August 13th.
August 5 – 11, 2024

Phillipsdale Landing

Sondes were swapped this week on the morning of August 6th. Overall, the water quality at Phillipsdale Landing was good to fair this week. The weather was rainy, with 1.65 inches of precipitation recorded at T.F. Green. The Blackstone River flow fluctuated through the week in response to rain. Surface salinity averaged 16.6 ppt and ranged from 5.6 ppt to 21.9 ppt. At the bottom, salinity averaged 22.5 ppt and ranged from 15.2 ppt to 26.9 ppt. Temperatures continued to increase this week, averaging 24.9°C at the surface and ranging 22.8°C – 27.3°C. At the bottom, temperatures averaged 24.3°C and ranged 22.6°C – 27.3°C.

Dissolved oxygen (DO) at Phillipsdale Landing remained above the hypoxia threshold (i.e., DO >2.9 mg/L) at the surface throughout the week, while DO at the bottom waters remained below the hypoxic threshold for most of the week. Surface DO average 6.2 mg/L and ranged from 1.3 mg/L to 20.8 mg/L. Bottom DO concentrations averaged 2.7 mg/L and ranged from 0.7 mg/L to 8.3 mg/L. The longest period of hypoxic conditions (22 hours) occurred at the bottom depth between the night of August 7th to the afternoon of August 8th. During this period, bottom DO averaged around 1.63 mg/L. Chlorophyll readings increased from last week, averaging 36.1 µg/L at the surface and 27.7 µg/L at the bottom. Maximum chlorophyll at the surface reached 235.3 µg/L on the afternoon of August 11th. Please note that tidal fluctuations and Blackstone River flows greatly influence water column salinity, temperature, and DO at this location.

Bullock Reach

Overall, water quality was good to fair at Bullock Reach this week. Salinity averaged 25.7 ppt, 28.4 ppt, and 30.8 ppt at the surface, middle, and bottom sondes, respectively. Surface salinity ranged 23.0 – 28.4 ppt, mid salinity ranged 24.7 – 30.2 ppt, and bottom salinity ranged 24.2 – 32.2 ppt. Surface temperature averaged 24.4°C and ranged from 22.5°C to 27.4°C. Mid temperatures averaged 24.0°C and ranged from 22.1°C to 26.0°C. Bottom temperatures averaged 22.4°C and ranged from 20.6°C to 25.4°C. DO at Bullock Reach remained above the hypoxia threshold (i.e., DO >2.9 mg/L) throughout the week at the surface. Middle and Bottom DO dropped below the hypoxia threshold frequently throughout the week. Surface DO averaged 6.4 mg/L and ranged 3.6 – 12.1 mg/L. In the mid waters, DO averaged 4.5 mg/L and ranged 2.1 – 6.6 mg/L. At the bottom, DO averaged 3.6 mg/L and ranged 2.4 – 5.4 mg/L.

The longest period of hypoxic conditions (6 hours and 15 minutes) occurred at the bottom depth on the morning of August 6th. During this period, bottom DO averaged around 2.74 mg/L. Chlorophyll readings ranged from low to elevated, with evidence of moderate phytoplankton blooms occurring throughout the week. Readings averaged 14.6 µg/L at the surface, 9.5 µg/L at mid-depth, and 3.0 µg/L at the bottom. The maximum surface chlorophyll was 61.8 µg/L on the night of August 11th.

May 21, 2025

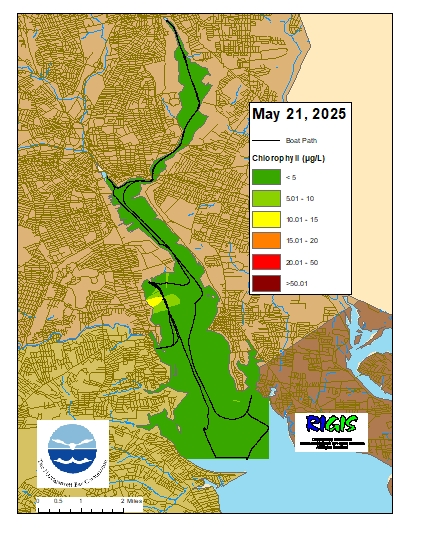
Surface chlorophyll data were collected on May 21, 2025, while the R/V Monitor was underway collecting nutrient samples in the Providence and Seekonk River estuary. The average chlorophyll concentrations were categorized as fair in the Edgewood Shoals, and as good in all other areas. Overall, chlorophyll ranged from 1.39 µg/L to 13.49 µg/L with an average of 2.92 µg/L. The chlorophyll concentrations from this date are presented in the map below using Inverse Distance Weighting (IDW) interpolation. 

May 7, 2025

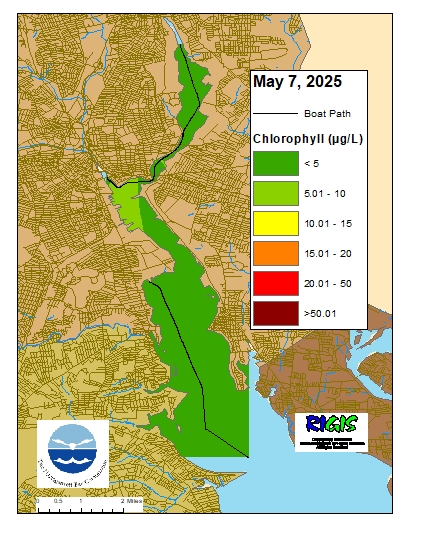
Surface chlorophyll data were collected on May 7, 2025, while the R/V Monitor was underway collecting nutrient samples in the Providence and Seekonk River estuary. The average chlorophyll concentrations were categorized as good in all areas surveyed. Overall, chlorophyll ranged from 1.78 µg/L to 8.30 µg/L with an average of 3.46 µg/L. The chlorophyll concentrations from this date are presented in the map below using Inverse Distance Weighting (IDW) interpolation. 

Scroll to Top