Nicole Flecchia

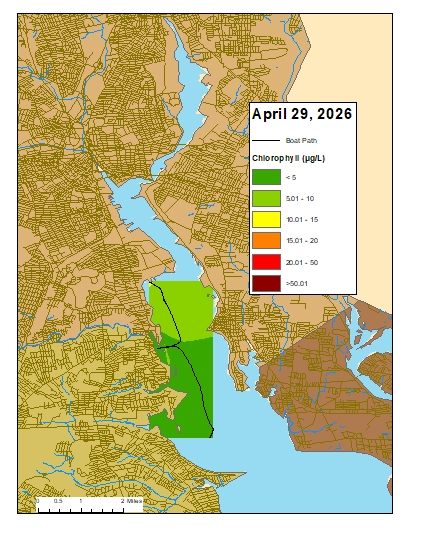
April 29, 2026

Surface chlorophyll data were collected on April 29, 2026, while the R/V Data Stream was underway collecting nutrient samples in the Providence and Seekonk River Estuaries. The average chlorophyll concentrations were categorized as good in all areas. The average chlorophyll concentrations were categorized as good to fair over all areas surveyed. Overall, chlorophyll ranged from 1.50 µg/L to 14.60 µg/L with an average of 4.50 µg/L. The chlorophyll concentrations from this date are presented in the map below using Inverse Distance Weighting (IDW) interpolation.

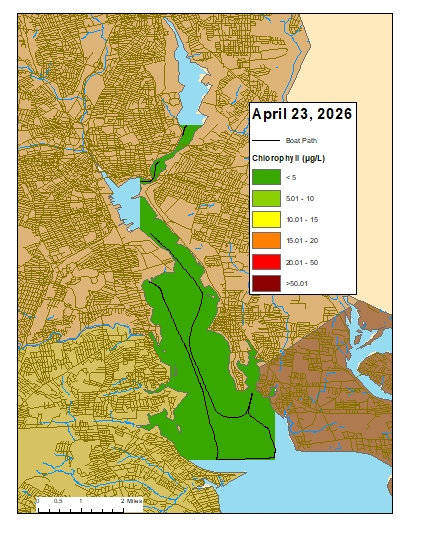
April 23, 2026

Surface chlorophyll data were collected on April 29, 2026, while the R/V Data Stream was underway collecting bacteria samples in the Providence and Seekonk River Estuaries. The average chlorophyll concentrations were categorized as good in all areas. The average chlorophyll concentrations were also categorized as good over all areas surveyed. Overall, chlorophyll ranged from 1.09 µg/L to 3.94 µg/L with an average of 1.96 µg/L. The chlorophyll concentrations from this date are presented in the map below using Inverse Distance Weighting (IDW) interpolation.

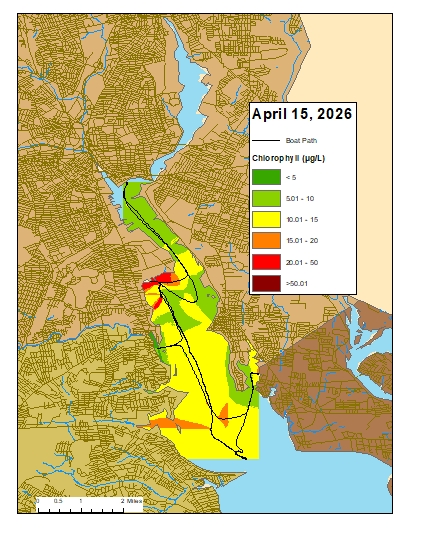
April 15, 2026

Surface chlorophyll data were collected on April 15, 2026, while the R/V Data Stream was underway collecting nutrient samples in the Providence and Seekonk River Estuaries. The average chlorophyll concentrations were categorized as fair in all areas. The average chlorophyll concentrations were also categorized as fair over all areas surveyed. Overall, chlorophyll ranged from 1.67 µg/L to 44.92 µg/L with an average of 13.52 µg/L. The chlorophyll concentrations from this date are presented in the map below using Inverse Distance Weighting (IDW) interpolation.

March 18, 2026

Nutrient samples were collected from seven river stations and seven bay stations on March 18th.  In the five days prior to sampling, 1.75” of precipitation were recorded at T.F. Green.

Among the river stations sampled, the highest total nitrogen (TN), total dissolved nitrogen (TDN), and dissolved inorganic nitrogen (DIN) were observed at Blackstone River @ Slater Mill (TN = 902 ppb, TDN = 1,210 ppb, DIN = 559 ppb). The lowest TN, TDN and DIN were observed at Pawtuxet River @ Broad St. (TN = 759 ppb, TDN = 657 ppb DIN = 461 ppb).

Among the bay stations sampled, the lowest TN, TDN and DIN were observed Phillipsdale Landing Surface (TN = 999 ppb, TDN = 981 ppb, DIN = 693 ppb). The lowest TN, TDN and DIN were observed at Bullock’s Reach Bottom (TN = 429 ppb, TDN = < 100 ppb DIN = 8.75 ppb).

The next scheduled sampling date is April 1st, 2026.

March 4, 2026

Nutrient samples were collected from nine river stations on March 4th.  In the five days prior to sampling, 0.72” of precipitation were recorded at T.F. Green.

Among the river stations sampled, the highest total nitrogen (TN), total dissolved nitrogen (TDN), and dissolved inorganic nitrogen (DIN) were observed at Ten Mile River @ Roger Williams Ave. (TN = 2,550 ppb, TDN = 2,570 ppb, DIN = 2,309.4 ppb). The lowest TN and DIN were observed at Moshassuck River @ Higginson Ave. (TN = 615 ppb, DIN = 509.8 ppb), while the lowest TDN was observed at Moshassuck River @ Footbridge at Mill St. (TDN = 834 ppb).

The next scheduled sampling date is March 18th, 2026.

February 18, 2026

Nutrient samples were collected from six river stations on February 18th.  In the five days prior to sampling, 0.25” of precipitation were recorded at T.F. Green.

Among the river stations sampled, the highest total nitrogen (TN), total dissolved nitrogen (TDN), and dissolved inorganic nitrogen (DIN) were observed at Blackstone River @ Slater Mill (TN = 1,430 ppb, TDN = 2,170 ppb, DIN = 1,249.2 ppb). The lowest TN, TDN, and DIN were observed at Moshassuck River @ Higginson Ave. (TN = 710 ppb, TDN = 702 ppb, DIN = 595.9 ppb).

The next scheduled sampling date is March 4th, 2026.

February 4, 2026

Nutrient samples were collected from nine river stations on February 4th.  In the five days prior to sampling, 0.0” of precipitation were recorded at T.F. Green.

Among the river stations sampled, the highest total nitrogen (TN), total dissolved nitrogen (TDN), and dissolved inorganic nitrogen (DIN) were observed at Ten Mile River @ Roger Williams Ave. (TN = 3,530 ppb, TDN = 3,510 ppb, DIN = 3,336 ppb). The lowest TN, TDN, and DIN were observed at Coles River @ Milford Rd. (TN = 830 ppb, TDN = 938 ppb, DIN = 731 ppb).

The next scheduled sampling date is February 18th, 2026.

January 21, 2026

Nutrient samples were collected from seven river stations on January 21st.  In the five days prior to sampling, 0.7” of precipitation were recorded at T.F. Green.

Among the river stations sampled, the highest total nitrogen (TN), total dissolved nitrogen (TDN), and dissolved inorganic nitrogen (DIN) were observed at Pawtuxet River @ Broad St. (TN = 1,710 ppb, TDN = 1,710 ppb, DIN = 1,519.5 ppb). The lowest TN, TDN, and DIN were observed at Moshassuck River @ Footbridge at Mill St. (TN = 563 ppb, TDN = 572 ppb, DIN = 424.3 ppb).

The next scheduled sampling date is February 4th, 2026.

January 7, 2026

Nutrient samples were collected from thirteen river stations on January 7th.  In the five days prior to sampling, 0.11” of precipitation were recorded at T.F. Green.

Among the river stations sampled, the highest total nitrogen (TN), total dissolved nitrogen (TDN), and dissolved inorganic nitrogen (DIN) were observed at Pawtuxet River @ Broad St. (TN = 2,160 ppb, TDN = 2,330 ppb, DIN = 1,234.2 ppb). The lowest TN, TDN, and DIN were observed at Woonasquatucket River @ Manton Ave. Bridge (TN = 808 ppb, TDN = 910 ppb, DIN = 655.9 ppb).

The next scheduled sampling date is January 21st, 2026.

November 3 – 9, 2025

Phillipsdale Landing

Sondes were retrieved for the end of the season on the morning of November 4th. Overall, the water quality at Phillipsdale Landing was good this week. There was no rain recorded at T.F. Green. The Blackstone River flow reached a minimum on November 5th, and then increased for the remainder of the week. Surface salinity averaged 15.1 ppt and ranged from 6.1 ppt–25.1 ppt. At the bottom, salinity averaged 24.3 ppt and ranged from 14.1 ppt–28.9 ppt. Temperatures decreased this week, averaging 12.4°C at the surface and 13.9°C at the bottom. Surface temperatures ranged from 10.1°C–14.1°C, while bottom temperatures ranged from 12.4°C–14.6°C.

Dissolved oxygen (DO) at Phillipsdale Landing remained above the hypoxia threshold (i.e., DO>2.9mg/L) in both the surface and bottom waters. Surface DO averaged 8.1 mg/L and ranged from 6.3 mg/L–9.9 mg/L. Bottom DO concentrations averaged 6.4 mg/L and ranged from 5.7 mg/L–7.6 mg/L. Chlorophyll readings remained relatively constant compared to last week, averaging 0.4 µg/L at the surface and 2.5 µg/L at the bottom. Maximum chlorophyll at the surface reached 1.6 µg/L on the morning of November 3rd. Please note that tidal fluctuations and Blackstone River flows greatly influence water column salinity, temperature, and DO at this location.

Bullock’s Reach

Sondes were retrieved for the end of the season on the morning of November 7th. Overall, water quality was good at Bullock’s Reach this week. Salinity averaged 24.5 ppt, 24.0 ppt, and 29.3 ppt at the surface, middle, and bottom sondes, respectively. Surface salinity ranged 10.0–29.3 ppt, mid-depth salinity ranged 9.6–30.1 ppt, and bottom salinity ranged 27.2–30.5 ppt. Surface temperature averaged 12.3°C and ranged from 10.4°C to 13.3C. Mid-depth temperatures averaged 12.6°C and ranged from 11.7°C to 13.5°C. Bottom temperatures averaged 12.6°C and ranged from 11.6°C to 13.5°C.

Dissolved oxygen (DO) at Bullock’s Reach remained above the hypoxia threshold (i.e., DO >2.9 mg/L) throughout the week. Surface DO averaged 8.4 mg/L and ranged 8.0–9.3 mg/L. In the mid-depth waters, DO averaged 8.5 mg/L and ranged 7.8–9.3 mg/L. At the bottom, DO averaged 8.2 mg/L and ranged 7.7–8.9 mg/L.  Chlorophyll concentrations remained relatively constant compared to last week. Readings averaged 1.6 µg/L at the surface, 2.4 µg/L at mid-depth, and 4.7 µg/L at the bottom.  The maximum surface chlorophyll was 3.1 µg/L on the morning of November 3rd.

Scroll to Top