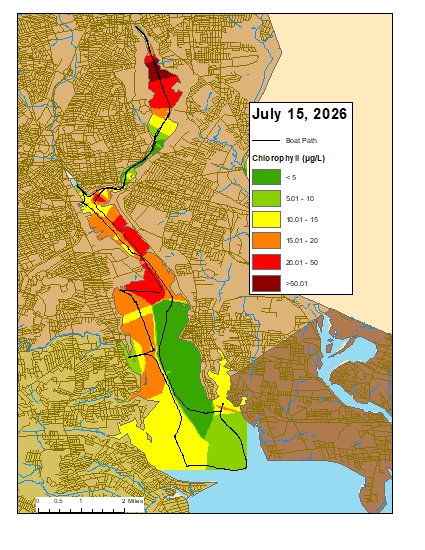
Nicole Flecchia

May 12, 2026

Phytoplankton samples were collected on May 12, 2026 at Bullock’s Reach and analyzed in the laboratory shortly after collection.

On this day, the water temperature was 13.60 °C, the salinity was 22.93 PSU, and the chlorophyll a was 8.36 µg/L.

It was sunny and clear on this day. The qualitative tow net sample had a short filtration time and contained a large volume of copepods.

The analysis of the quantitative whole water sample revealed a total of 749,000 cells/L. The microflagellates were found at 673,000 cells/L. The most predominant phytoplankton genera were Silicoflagellate spp. at 40,000 cells/L, Skeletonema spp. at 13,000 cells/L, and Unknown Diatom spp. at 10,000 cells/L.

200x phase contrast image of Pediastrum spp.

Pediastrum is a genus of freshwater green algae found in lakes, ponds and along shores where water is rich in nutrients such as nitrogen. They are nonmotile and form flat colonies with concentric rings that resemble snowflakes. These groupings can both improve their buoyancy in the water column and help prevent predation.

April 29, 2026

Phytoplankton samples were collected on April 29, 2026 at Bullock Reach and analyzed in the laboratory shortly after collection.

On this day, the water temperature was 10.70 °C, the salinity was 24.63 PSU.

The qualitative tow net sample had a moderate filtration time. The filtrate was cloudy and reddish brown with some darker particulates.

The analysis of the quantitative whole water sample revealed a total of 2,224,000 cells/L. The microflagellates were found at 194,000 cells/L. The most predominant phytoplankton genera were Skeletonema spp. at 1,694,000 cells/L, Thalassiosira spp. at 128,000 cells/L, and Chaetoceros spp.at 92,000 cells/L.

200x phase contrast image of Asterionellopsis spp.

Asterionellopsis is a genus of neritic pennate diatom found in cold to temperate coastal waters. Their cells have two chloroplasts each and are joined by valve faces into star-shaped or spiraling chains.

April 15, 2026

Phytoplankton samples were collected on April 15, 2026 at Bullock Reach and analyzed in the laboratory shortly after collection.

It was sunny with light wind on this day. The water temperature was 12.66 °C, the salinity was 19.05 PSU, and the chlorophyll a was 15.54 ug/L.

The qualitative tow net sample had a moderate filtration time. The filtrate was cloudy and reddish brown.

The analysis of the quantitative whole water sample revealed a total of 37,240,000 cells/L. The microflagellates were found at 320,000 cells/L. The most predominant phytoplankton genera were Skeletonema spp. at 33,763,000 cells/L, Chaetoceros spp. at 1,653,000 cells/L, and Leptocylindrus spp. at 765,000 cells/L.

200x phase contrast image of Thalassiosira spp.

Thalassiosira is a large genus of mostly marine diatoms which are known for their bloom formations. They are responsible for significant algal blooms worldwide in temperate, boreal, and polar regions, particularly in layers underlying sea ice and in upwelling areas.

May 20, 2026

Surface chlorophyll data were collected on May 20, 2026, while the R/V Data Stream was underway collecting bacteria samples in the Providence and Seekonk River Estuaries. The average chlorophyll concentrations were categorized as fair in all areas. The average chlorophyll concentrations were also categorized as fair over all areas surveyed. Overall, chlorophyll ranged from 0.97 µg/L to 120.89 µg/L with an average of 6.97 µg/L. The chlorophyll concentrations from this date are presented in the map below using Inverse Distance Weighting (IDW) interpolation.

May 7, 2026

Surface chlorophyll data were collected on May 7, 2026, while the R/V Data Stream was underway collecting bacteria samples in the Providence and Seekonk River Estuaries. The average chlorophyll concentrations were categorized as good in all areas. The average chlorophyll concentrations were categorized as good to fair over all areas surveyed. Overall, chlorophyll ranged from 1.60 µg/L to 13.44 µg/L with an average of 4.63 µg/L. The chlorophyll concentrations from this date are presented in the map below using Inverse Distance Weighting (IDW) interpolation.

April 29, 2026

Surface chlorophyll data were collected on April 29, 2026, while the R/V Data Stream was underway collecting nutrient samples in the Providence and Seekonk River Estuaries. The average chlorophyll concentrations were categorized as good in all areas. The average chlorophyll concentrations were categorized as good to fair over all areas surveyed. Overall, chlorophyll ranged from 1.50 µg/L to 14.60 µg/L with an average of 4.50 µg/L. The chlorophyll concentrations from this date are presented in the map below using Inverse Distance Weighting (IDW) interpolation.

April 23, 2026

Surface chlorophyll data were collected on April 29, 2026, while the R/V Data Stream was underway collecting bacteria samples in the Providence and Seekonk River Estuaries. The average chlorophyll concentrations were categorized as good in all areas. The average chlorophyll concentrations were also categorized as good over all areas surveyed. Overall, chlorophyll ranged from 1.09 µg/L to 3.94 µg/L with an average of 1.96 µg/L. The chlorophyll concentrations from this date are presented in the map below using Inverse Distance Weighting (IDW) interpolation.

April 15, 2026

Surface chlorophyll data were collected on April 15, 2026, while the R/V Data Stream was underway collecting nutrient samples in the Providence and Seekonk River Estuaries. The average chlorophyll concentrations were categorized as fair in all areas. The average chlorophyll concentrations were also categorized as fair over all areas surveyed. Overall, chlorophyll ranged from 1.67 µg/L to 44.92 µg/L with an average of 13.52 µg/L. The chlorophyll concentrations from this date are presented in the map below using Inverse Distance Weighting (IDW) interpolation.

March 18, 2026

Nutrient samples were collected from seven river stations and seven bay stations on March 18th.  In the five days prior to sampling, 1.75” of precipitation were recorded at T.F. Green.

Among the river stations sampled, the highest total nitrogen (TN), total dissolved nitrogen (TDN), and dissolved inorganic nitrogen (DIN) were observed at Blackstone River @ Slater Mill (TN = 902 ppb, TDN = 1,210 ppb, DIN = 559 ppb). The lowest TN, TDN and DIN were observed at Pawtuxet River @ Broad St. (TN = 759 ppb, TDN = 657 ppb DIN = 461 ppb).

Among the bay stations sampled, the lowest TN, TDN and DIN were observed Phillipsdale Landing Surface (TN = 999 ppb, TDN = 981 ppb, DIN = 693 ppb). The lowest TN, TDN and DIN were observed at Bullock’s Reach Bottom (TN = 429 ppb, TDN = < 100 ppb DIN = 8.75 ppb).

The next scheduled sampling date is April 1st, 2026.

March 4, 2026

Nutrient samples were collected from nine river stations on March 4th.  In the five days prior to sampling, 0.72” of precipitation were recorded at T.F. Green.

Among the river stations sampled, the highest total nitrogen (TN), total dissolved nitrogen (TDN), and dissolved inorganic nitrogen (DIN) were observed at Ten Mile River @ Roger Williams Ave. (TN = 2,550 ppb, TDN = 2,570 ppb, DIN = 2,309.4 ppb). The lowest TN and DIN were observed at Moshassuck River @ Higginson Ave. (TN = 615 ppb, DIN = 509.8 ppb), while the lowest TDN was observed at Moshassuck River @ Footbridge at Mill St. (TDN = 834 ppb).

The next scheduled sampling date is March 18th, 2026.

Scroll to Top