July 8, 2026

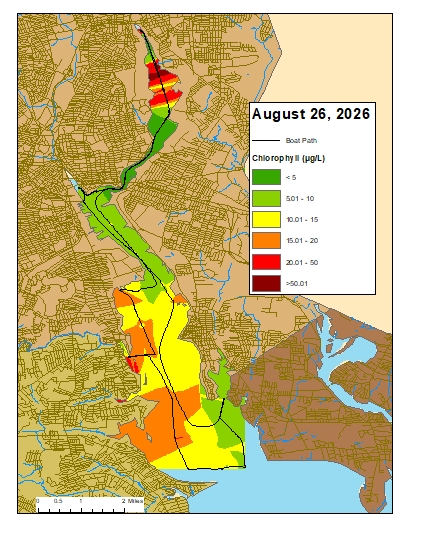
Surface chlorophyll data were collected on July 8, 2026, while the R/V Data Stream was underway collecting nutrient samples in the Providence and Seekonk River Estuaries. The chlorophyll concentrations were categorized as fair overall. The North Providence River Channel, Southern Providence River and Pawtuxet River Area exhibited good water quality with average chlorophyll concentrations <5 µg/L. The Seekonk River and Edgewood Shoal had fair water quality with average chlorophyll concentrations that ranged between 5 µg/L and 20 µg/L. None of the sampled areas exhibited poor water quality with average chlorophyll concentration > 20 µg/L. Overall, chlorophyll ranged from 1.11 µg/L to 78.74 µg/L with an average of 7.31 µg/L. The chlorophyll concentrations from this date are presented in the map below using Inverse Distance Weighting (IDW) interpolation.

June 29 – July 5, 2026

Walkers Point

Sondes were swapped this week on the morning of June 30th. Overall, the water quality at Walkers Point was good to fair this week. Weather conditions included light rain events this week, with 0.26 inches of precipitation recorded at T.F. Green. Surface salinity averaged 20.6 ppt and ranged from 10.6 ppt to 28.9 ppt. At the bottom, salinity averaged 26.3 ppt and ranged from 24.1 ppt to 29.1 ppt. Temperatures averaged 25.8°C at the surface and 22.5°C at the bottom. Surface temperatures ranged from 22.0°C to 30.1°C, while bottom temperatures ranged from 20.9°C to 24.0°C.

Dissolved oxygen (DO) at Walkers Point dropped below the hypoxia threshold (i.e., DO>2.9mg/L) at both the surface and bottom depths. The longest periods of hypoxic conditions spanned 5 hours, occurring at the bottom depth on the morning of June 29th. During this period, the DO averaged around 2.33 mg/L. Surface DO averaged 10.2 mg/L and ranged from 2.5 mg/L to 24.5 mg/L. Bottom DO concentrations averaged 4.2 mg/L and ranged from 1.9 mg/L to 7.7 mg/L. Chlorophyll readings averaged 21.0 µg/L at the surface and 9.9 µg/L at the bottom. Maximum chlorophyll at the surface reached 195.5 µg/L on the morning of July 1st.

Bullock Reach

Overall, water quality was good to fair at Bullock Reach this week. Salinity averaged 28.3 ppt, 30.2 ppt, and 31.9 ppt at the surface, middle, and bottom sondes, respectively. Surface salinity ranged 26.1 – 29.8 ppt, middle salinity range 28.0 – 31.7 ppt, and bottom salinity ranged 30.3 – 32.7 ppt. Surface temperature averaged 25.3°C and ranged from 23.5°C to 27.7°C. Middle temperature averaged 23.7°C and ranged from 21.4°C to 26.4°C. Bottom temperatures averaged 20.7°C and ranged from 18.1°C to 23.9°C.

Dissolved oxygen (DO) at Bullock Reach remained above the hypoxia threshold (i.e., DO>2.9mg/L) at the surface, but dropped below the hypoxia threshold at the middle and bottom depths. The middle depth had a brief drop into hypoxic conditions on the morning of July 4th for two 15-minute intervals. The longest period of hypoxic conditions at the bottom depth spanned 12 hours and 15 minutes, spanning the night of June 29th to the morning of June 30th.  During this period, the bottom DO averaged around 2.73 mg/L. Surface DO averaged 7.8 mg/L and ranged 4.4 – 12.8 mg/L. Middle DO averaged 5.9 mg/L and ranged 2.7 – 9.5 mg/L. At the bottom, DO averaged 3.4 mg/L and ranged 2.3 – 6.0 mg/L.  Chlorophyll readings ranged from low to elevated throughout the week. Readings averaged 3.2 µg/L at the surface, 15.5 µg/L at the middle, and 12.2 µg/L at the bottom.  The maximum bottom chlorophyll was 41.1 µg/L on the morning of July 2nd.

July 8, 2026

Water column profiles were conducted using a Seabird Electronics profiler at seven locations in the Providence River and one location in the Seekonk River on July 8, 2026. In the five days leading up to this, there were 2.89 inches of rain recorded at T.F. Green International Airport (Warwick, RI). The water column was strongly stratified at Pawtuxet Cove and Phillipsdale Landing, moderately stratified at India Point Park, Bullock’s Reach, and Conimicut Point, weakly stratified at Edgewood Yacht Club and Pomham Rocks, and well-mixed at Edgewood Shoal.

Dissolved oxygen conditions were below the hypoxia threshold (2.9 mg/L) in the lower part of the water column at Edgewood Yacht Club, Edgewood Shoal, Pawtuxet Cove, Pomham Rocks, Phillipsdale Landing, and India Point Park. The highest fluorescence reading was observed about 1.00 meters below the surface at Phillipsdale Landing.

June 24, 2026

Water column profiles were conducted using a Seabird Electronics profiler at six locations in the Providence River and one location in the Seekonk River on June 24, 2026. In the five days leading up to this, there were 2.02 inches of rain recorded at T.F. Green International Airport (Warwick, RI). The water column was moderately stratified at India Point Park, Pomham Rocks, and Conimicut Point, weakly stratified at, Bullock’s Reach, Phillipsdale Landing, and Edgewood Yacht Club, and well-mixed at Pawtuxet Cove.

Dissolved oxygen conditions were below the hypoxia threshold (2.9 mg/L) in the lower part of the water column at Edgewood Yacht Club, Pawtuxet Cove, Pomham Rocks, Phillipsdale Landing, and India Point Park. The highest fluorescence reading was observed about 1.25 meters below the surface at Edgewood Yacht Club.

July 8, 2026

Water clarity was measured at eight locations in the Providence River and Seekonk River estuaries on July 8, 2026. In the five days prior to the survey, 2.89 inches of precipitation were recorded at TF Green. Secchi depth averaged 2.3 meters. The lowest clarity this week (1.7 meters) was measured at Phillipsdale Landing, while the greatest clarity (2.5 meters) was observed at several sampling locations. There was a general north-to-south gradient in water clarity among the sites this week. Overall, water clarity decreased from the previous measurements (data collected June 24, 2026).

June 17, 2026

On June 17th, 2026, twenty stations were sampled for fecal coliform bacteria in the Providence and Seekonk Rivers; five of these stations were also sampled for enterococci bacteria. In the five days prior to sampling, 0.01 inches of precipitation were recorded at TF Green.

Fecal coliform counts were lower in the Seekonk River, compared to the previous sampling on June 3rd (geometric mean of 46 MPN/100 mL compared to 76 MPN/100 mL on 5/20). Fecal coliform counts were also lower in the Providence River, compared to the previous sampling (geometric mean of 9 MPN/100 mL on June 17th compared to 13 on June 3rd). 

Enterococci results had an overall geometric mean of 14 MPN/100 mL. Enterococci counts ranged from <10 MPN/100 mL at most sites to 30 MPN/100 mL at Point Street Bridge and Phillipsdale Landing.

The next scheduled sampling date is July 1st.

Summary of Rhode Island Bacteria Standards for Saltwater Primary Contact and Shellfishing

 ​​​Fec​al Co​li​fo​r​mEnterococci
Primary
Con​​​t​a​c​t1​​​​​
Geom​e​tric ​m​e​a​n​ ≤50​ MPN/1​​00​ mL​
<10% ​o​f​​ samples >4​00 MPN/100 ​mL
Geom​etric mean ≤35 colo​nies​/100 mL​
All sa​mples ≤104 colonies/100 ​​mL2
ShellfishingGeometr​ic mean ≤14 MPN/100​ mL
<10% of samples >49 MPN/100 mL3​
NO ENTEROCOCCI CR​ITERIA​

1Fecal coliform primary contact criteria app​lied only when adequate enterococci data are not available; 2Single sample maximum criterion for determining beach swimming advisories at designated beaches as evaluated by the Rhode Island Department of Health; 3For a three-tube decimal dilution.

Table adapted from Rhode Island Water Quality Regulations (250-RICR-150-05-1)​; see regulations for complete details.​​​​​​​​​​

June 3, 2026

On June 3rd, 2026, twenty stations were sampled for fecal coliform bacteria in the Providence and Seekonk Rivers; five of these stations were also sampled for enterococci bacteria. In the five days prior to sampling, 0.25 inches of precipitation were recorded at TF Green.

Fecal coliform counts were lower in the Seekonk River, compared to the previous sampling on May 20th (geometric mean of 76 MPN/100 mL compared to 91 MPN/100 mL on 5/20). Fecal coliform counts were also lower in the Providence River, compared to the previous sampling (geometric mean of 13 MPN/100 mL on June 3rd compared to 18 on May 20th). 

Enterococci results had an overall geometric mean of 14 MPN/100 mL. Enterococci counts ranged from <10 MPN/100 mL at most sites to 134 MPN/100 mL at Point Street Bridge.

The next scheduled sampling date is June 17th.

Summary of Rhode Island Bacteria Standards for Saltwater Primary Contact and Shellfishing

 ​​​Fec​al Co​li​fo​r​mEnterococci
Primary
Con​​​t​a​c​t1​​​​​
Geom​e​tric ​m​e​a​n​ ≤50​ MPN/1​​00​ mL​
<10% ​o​f​​ samples >4​00 MPN/100 ​mL
Geom​etric mean ≤35 colo​nies​/100 mL​
All sa​mples ≤104 colonies/100 ​​mL2
ShellfishingGeometr​ic mean ≤14 MPN/100​ mL
<10% of samples >49 MPN/100 mL3​
NO ENTEROCOCCI CR​ITERIA​

1Fecal coliform primary contact criteria app​lied only when adequate enterococci data are not available; 2Single sample maximum criterion for determining beach swimming advisories at designated beaches as evaluated by the Rhode Island Department of Health; 3For a three-tube decimal dilution.

Table adapted from Rhode Island Water Quality Regulations (250-RICR-150-05-1)​; see regulations for complete details.​​​​​​​​​​

May 27, 2026

Nutrient samples were collected from seven river stations and seven bay stations on May 27th. All bay stations were sampled at the surface and bottom. In the five days prior to sampling, 1.04 inches of precipitation were recorded at T.F. Green. 

Among the river stations sampled, the highest total nitrogen (TN) and total dissolved nitrogen (TDN) were observed at Blackstone River @ Slater Mill and Blackstone River @ Bikepath Bridge (TN = 1,080 ppb, TDN = 1,090 ppb). The highest dissolved inorganic nitrogen (DIN) was observed at Blackstone River @ Slater Mill (757.7 ppb). The lowest TN was observed at Woonasquatucket River @ Manton Ave. Bridge (734 ppb). The lowest TDN and DIN were observed at Pawtuxet River @ Broad St. (TDN = 393 ppb, DIN = 150.7).

Among the bay stations sampled, the highest surface TN and TDN were observed at Phillipsdale Landing (TN = 1,070 ppb, TDN = 870 ppb). The highest DIN was observed at Pawtuxet Cove (466.5 ppb). The lowest surface TN was observed at Bullock Reach Buoy (464 ppb). The lowest TDN was observed at Conimicut Point (149 ppb). The lowest surface DIN was observed at Conimicut Point, Edgewood Yacht Club, and Bullock Reach Buoy (13 ppb, reflecting minimum detection limits for DIN).

The next scheduled sampling date is June 10th, 2026.​

May 12-13, 2026

Nutrient samples were collected from thirteen river stations and eight bay stations on May 12-13th. All bay stations were sampled at the surface, and Edgewood Shoal was sampled at the surface and bottom. In the five days prior to sampling, 0.57 inches of precipitation were recorded at T.F. Green. 

Among the river stations sampled, the highest total nitrogen (TN), and dissolved inorganic nitrogen (DIN) were observed Ten Mile River at Central Ave. (TN = 1,510 ppb, DIN = 1,041.1 ppb). The highest  total dissolved nitrogen (TDN) was observed at Moshassuck River @ Footbridge at Mill St. (1,610 ppb). However, a significantly higher TDN compared to the TN observed at this site may indicate an issue with the sampling or analysis. The lowest TN, and TDN were observed at Moshassuck River @ Higginson Ave (TN = 470 ppb, TDN = 329 ppb). The lowest DIN was observed at Coles River @ Milford Rd. (45.4 ppb).

Among the bay stations sampled, the highest surface TN and TDN were observed at Phillipsdale Landing (TN = 1,110 ppb, TDN = 1,080 ppb). The highest surface DIN was observed at Pawtuxet Cove (598.2 ppb). The lowest surface TN was observed at Edgewood Shoal (507 ppb). The lowest TDN was observed at Conimicut Point (<100.0 ppb). The lowest surface DIN was observed at Edgewood Yacht Club and Edgewood Shoal (13 ppb, reflecting minimum detection limits for DIN).

The next scheduled sampling date is May 27th, 2026.​

June 22 – 28, 2026

Walkers Point

Overall, the water quality at Walkers Point was good to fair this week. Weather conditions included light rain events this week, with 2.09 inches of precipitation recorded at T.F. Green. Surface salinity averaged 20.5 ppt and ranged from 10.0 ppt to 27.5 ppt. At the bottom, salinity averaged 20.5 ppt and ranged from 10.0 ppt to 27.5 ppt. Temperatures averaged 22.4°C at the surface and 21.3°C at the bottom. Surface temperatures ranged from 20.8°C to 25.7°C, while bottom temperatures ranged from 20.1°C to 22.6°C.

Dissolved oxygen (DO) at Walkers Point remained above the hypoxia threshold (i.e., DO>2.9mg/L) at the surface but dropped below the hypoxia threshold at the bottom depths. The longest periods of hypoxic conditions spanned 20.25 hours, occurring at the bottom depth from the night of June 24th to the afternoon of June 25th. During this period, the DO averaged around 2.46 mg/L. Surface DO averaged 7.0 mg/L and ranged from 3.5 mg/L to 12.8 mg/L. Bottom DO concentrations averaged 3.0 mg/L and ranged from 1.2 mg/L to 5.2 mg/L. Chlorophyll readings averaged 10.34 µg/L at the surface and 3.43 µg/L at the bottom. Maximum chlorophyll at the surface reached 37.45 µg/L on the afternoon of June 27th.

Please note that DCP connection issues are ongoing during this deployment and data will be updated once deployment is retrieved.

Bullock Reach

Sondes were swapped this week on the morning of June 24th. Overall, water quality was good to fair at Bullock Reach this week. Salinity averaged 28.8 ppt, 30.0 ppt, and 20.6 ppt at the surface, middle, and bottom sondes, respectively. Surface salinity ranged 26.6 – 30.1 ppt, middle salinity range 28.1 – 31.6 ppt, and bottom salinity ranged 30.52 – 32.8 ppt. Surface temperature averaged 22.1°C and ranged from 20.8°C to 24.7°C. Middle temperature averaged 21.4°C and ranged from 19.6°C to 23.4°C. Bottom temperatures averaged 19.3°C and ranged from 18.1°C to 22.1°C.

Dissolved oxygen (DO) at Bullock Reach remained above the hypoxia threshold (i.e., DO>2.9mg/L) at the surface and middle depths, but dropped below the hypoxia threshold at the bottom depth. The longest periods of hypoxic conditions spanned 1 hours, occurring at the bottom depth from the night of June 28th.  During this period, the bottom DO averaged around 2.82 mg/L. Surface DO averaged 7.5 mg/L and ranged 5.8 – 10.2 mg/L. Middle DO averaged 6.2 mg/L and ranged 4.1 – 8.2 mg/L. At the bottom, DO averaged 4.5 mg/L and ranged 2.6 – 8.1 mg/L.  Chlorophyll readings ranged from low to elevated throughout the week. Readings averaged 10.7 µg/L at the surface, 13.3 µg/L at the middle, and 12.7 µg/L at the bottom.  The maximum bottom chlorophyll was 45.7 µg/L on the morning of June 26th.

Scroll to Top