Week of December 10 – 16, 2023
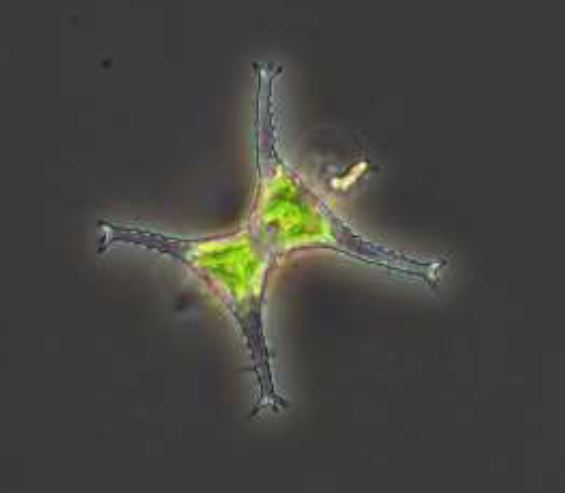
Phytoplankton samples were collected on December 13, 2023 at Bullock’s Reach and analyzed in the laboratory shortly after collection. It was calm and brisk on Narragansett Bay with an outgoing tide. The qualitative tow net sample had a moderate filter time, and the filtrate was a light brown color with some particulate matter. The analysis of the quantitative whole water sample revealed a total of 81,000 cells per liter. The micro flagellates were found at 11,000 cells/L. The most predominant phytoplankton genus was Skeletonema spp. at 31,000 cells/L. Other representative genera include Leptocylindrus spp. and Guinardia spp. The photo featured this week is a 200x phase-contrast image of Staurastrum, a type of green algae in the desmid family. It gets its name from the Greek “stauron” which means cross and “astron” which means star. It is made of highly constricted unicells that are radially symmetrical and can be distinguished by cell wall patterns. Staurastrum is a food source for zooplankton in the aquatic food web.