Week of October 1 – 7, 2023

​Nutrient samples were collected from seven river stations and seven bay stations on October 4th. All bay stations were sampled at the surface and bottom. In the five days prior to sampling, there was 1.27 inches of rainfall recorded at T.F. Green.

Among the river stations sampled, the highest total nitrogen (TN), total dissolved nitrogen (TDN), an dissolved inorganic nitrogen (DIN) concentrations were observed at Moshassuck River @ Footbridge at Mill St. (TN=787 ppb, TDN = 873 ppb, DIN = 571.4 ppb). The lowest TN, TDN, DIN were observed at Moshassuck River @ Higginson Ave. (TN = 627 ppb, TDN = 614 ppb, DIN = 382.6 ppb).

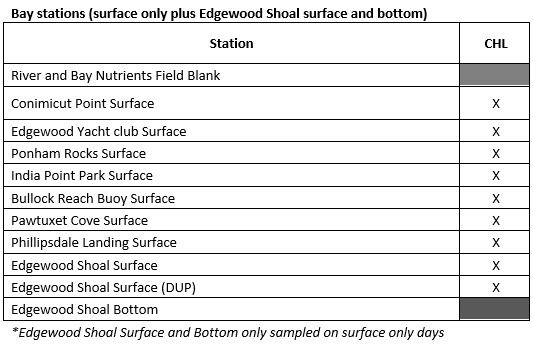
Among the bay stations sampled, the highest surface TN, TDN, and DIN were observed at Phillipsdale Landing (TN = 1,060, TDN = 1,030 ppb, DIN = 596.4 ppb).The lowest surface concentrations were observed at Edgewood Yacht Club for TN (TN = 701.5 ppb, average of duplicates), at the Bullock Reach Buoy for TDN (TDN = 727 ppb), and at Conimicut Point for DIN (DIN = 312.3 ppb). Chlorophyll a concentrations at the surface bay stations averaged 1.32 μg/L overall with a maximum of 2.93 μg/L at the Bullock Reach Buoy.

September 24-20, 2023

Surface chlorophyll data were collected on September 27, 2023 while the R/V Monitor was underway collecting nutrient samples in the Providence and Seekonk River estuaries.  The average chlorophyll concentrations were categorized Good in the areas surveyed. Overall, chlorophyll ranged from 1.15 µg/L to 4.50 µg/L with an average of 1.96 µg/L. The chlorophyll concentrations from this date are presented in the map below using Inverse Distance Weighting (IDW) interpolation. 

September 2023

Phillipsdale Landing

The Phillipsdale Landing sondes have been deployed for the season since May 9th, 2023 utilizing a new setup allowing staff access to the equipment from the boat instead of standing on the dock. During the month of September, sondes were changed out for routine maintenance on September 14th and 27th. 

Surface DO remained above the hypoxia threshold all month. The bottom waters were hypoxic periodically throughout the month, with the longest sustained hypoxic periods (10 hours) occurring in the early morning of September 10th and again on the afternoon of the 10th and the morning of the 11th. DO averaged 8.2 mg/L at the surface with a minimum of 3.2 mg/L, while bottom waters averaged 4.4 mg/L with a minimum of 0.0 mg/L. 

Chlorophyll readings were frequently elevated during the first half of the month, suggestive of phytoplankton blooms, but went back down in the second half of the month. The surface and bottom readings averaged 12.0 µg/L and 6.1 µg/L, respectively. 

Bullock Reach

The Bullock Reach buoy was deployed June 1st for the 2023 season. During the month of September, sondes were changed out for routine maintenance on September 7th and 21st.

Surface DO remained above the hypoxia threshold all month. There were a few brief periods of hypoxic conditions in the middle waters, with the longest duration at 1.5 hours on September 24th. The bottom waters were hypoxic periodically throughout the month, with the longest sustained period of hypoxic conditions at 26 hours between the 13th and 14th. Surface, middle, and bottom DO averaged 7.3 mg/L, 5.4 mg/L, and 4.0 mg/L, respectively.

Chlorophyll readings ranged from low to elevated, with evidence of moderate phytoplankton blooms occurring throughout the month. Readings averaged 11.7 µg/L at the surface, 9.6 µg/L at mid-depth, and 3.5 µg/L at the bottom. 

September 17-23, 2023

​Surface chlorophyll data were collected on September 20, 2023 while the R/V Monitor was underway collecting nutrient samples in the Providence and Seekonk River estuaries. The average chlorophyll concentrations were categorized as Good in the areas surveyed. Overall, chlorophyll ranged from 0.52 µg/L to 12.89 µg/L with an average of 2.92 µg/L. The chlorophyll concentrations from this date are presented in the map below using Inverse Distance Weighting (IDW) interpolation.

September 17-23, 2023

Phytoplankton samples were collected on September 20, 2023 at Bullock Reach and analyzed in the laboratory shortly after collection. Sonde data revealed the surface water temperature was 19.3°C, salinity was 24.5 psu, and chlorophyll a was 12.2 ug/L. The plankton tow net filtrate was a light brown color and had a long filter time. High particulates and comb jelly fish were detected. The whole water sample was analyzed and revealed a total of 76,000 cells per Liter.  The micro flagellates were found at 28,000 cells/L. The most predominant phytoplankton genus was Leptocylindrus spp.at 27,000 cells/L. Other representative genera include Skeletonema spp. and Chaetoceros spp. Today’s featured micrograph shows a centric diatom at 400x phase contrast. 

September 11-17, 2023

On September 14th, twenty stations were sampled for fecal coliform bacteria in the Providence River and Seekonk River; five of these stations were also sampled for enterococci bacteria. In the five days prior to sampling, precipitation totaled 1.23 inches as recorded at TF Green. 

Overall, bacteria counts were elevated this week. Fecal coliform counts were higher in the Seekonk River sites than in the Providence River sites (geometric means of 6,012 MPN/100 mL and 965 MPN/100 mL, respectively). The maximum count (24,000 MPN/100 mL) was measured at Crook Point. 

Enterococci results had an overall geometric mean of 528 MPN/100 mL. Enterococci counts ranged from 85 MPN/100mL at Conimicut Point to 2,987 MPN/100 mL at Phillipsdale Landing.

The table below lists the Rhode Island bacteria standards for primary contact and shellfishing established by the Rhode Island Department of Environmental Management (RIDEM). RIDEM defines primary contact as any recreational activities in which there is prolonged and intimate contact with water, involving considerable risk of ingesting water (e.g., swimming, diving, water skiing and surfing). Please note that the RIDEM bacteria standards are provided here for informational purposes only and are not intended to indicate official state compliance with primary contact or shellfishing standards.

Summary of Rhode Island Bacteria Standards for Saltwater Primary Contact and Shellfishing

 ​​Fecal Coli​fo​rmEnterococci
Primary Con​​​t​a​c​t1​​​​​Geom​e​tric me​a​n​ ≤50 MPN/1​​00​ mL
<10% ​o​f​​ samples >400 MPN/100 ​mL
Geom​etric mean ≤35 colo​nies/100 mL​
All sa​mples ≤104 colonies/100 ​​mL2
Shellfishing​Geometric mean ≤14 MPN/100​ mL
<10% of samples >49 MPN/100 mL3​
NO ENTEROCOCCI C​​RITERIA

1Fecal coliform primary contact criteria app​lied only when adequate enterococci data are not available; 2Single sample maximum criterion for determining beach swimming advisories at designated beaches as evaluated by the Rhode Island Department of Health; 3For a three-tube decimal dilution

Table adapted from Rhode Island Water Quality Regulations (250-RICR-150-05-1)​; see regulations for complete details.​​​​​​​​​​

Week of September 17 – September 23, 2023

​Nutrient samples were collected from 14 river stations and 8 bay stations on September 20th, 2023. Edgewood Shoal was sampled at the surface and bottom; all other bay stations were sampled at the surface only. In the five days prior to sampling, there were 1.55 inches of rainfall recorded at T.F. Green with the majority accumulated during a heavy rain event on September 18th.

Among the river stations sampled, the highest total nitrogen (TN), total dissolved nitrogen (TDN), and dissolved inorganic nitrogen (DIN) concentrations were observed at Ten Mile River at Roger Williams Ave. (TN = 1,305 ppb, TDN = 1,195 ppb, DIN = 771.5 ppb; all averaged with duplicates). The lowest TN and TDN were observed at Woonasquatucket River @ Valley St. (TN = 665 ppb, TDN = 635 ppb), while the lowest DIN was at Coles River @ Milford Rd. (DIN = 139.2 ppb). 

Among the bay stations sampled, the highest surface TN, TDN, and DIN concentrations were observed at Pawtuxet Cove (TN = 1,120 ppb, TDN = 1,070 ppb, DIN = 638.3 ppb). The lowest surface TN was observed at Conimicut Point (TN = 799 ppb), while the lowest surface TDN and DIN were observed at Bullock Reach (TDN = 607 ppb, DIN = 300 ppb).  Chlorophyll a concentrations at the surface bay stations averaged 2.8 μg/L overall with a maximum of 4.2 μg/L at Bullock Reach Buoy.

September 10-16, 2023

​Surface chlorophyll data were collected on September 14, 2023 while the R/V Monitor was underway collecting nutrient samples in the Providence and Seekonk River estuaries. The average chlorophyll concentrations were categorized fair in the areas surveyed. Overall, chlorophyll ranged from 1.68 µg/L to 89.11 µg/L with an average of 9.02 µg/L. The chlorophyll concentrations from this date are presented in the map below using Inverse Distance Weighting (IDW) interpolation. 

Week of November 26 – December 2, 2023

​Water clarity was measured at seven locations in the Providence River and Seekonk River estuaries on November 30th, 2023. Rainfall totaling 0.69 inches was recorded at TF Green in the five days prior to the survey. Secchi depth averaged 4.5 meters, compared to 4.7 meters on the previous survey (November 15th). The lowest clarity this week (3.0 meters) was measured at Phillipsdale Landing, while the greatest clarity (5.5 meters) was measured at Bullock Reach. There was a general north-to-south gradient of increasing water clarity among the sites this week. 

Week of November 12 – 18, 2023

​Water clarity was measured at seven locations in the Providence River and Seekonk River estuaries on November 15th, 2023. Trace amounts of rainfall was recorded at TF Green in the five days prior to the survey. Secchi depth averaged 4.7 meters, compared to 3.0 meters on the previous survey (November 1st). The lowest clarity this week (3.4 meters) was measured at India Point, while the greatest clarity (5.8 meters) was measured at Conimicut Point. There was a general north-to-south gradient of increasing water clarity among the sites this week. ​

Scroll to Top