March 17-23, 2024

​Phytoplankton samples were collected on March 20, 2024 at Bullock Reach and analyzed in the laboratory shortly after collection. It was partly sunny, breeze and brisk on Narragansett Bay. The qualitative tow net sample had a long filtration time, and the filtrate was a dark brown color. Some sediment and jellyfish were found in the sample. 

The analysis of the quantitative whole water sample revealed a total of 3,536,000 cells per Liter. The micro flagellates were found at 20,000 cells/L. The most predominant phytoplankton genus was Thalassiosira spp. at 1,888,000 cells/L. Other representative genera include Skeletonema spp. and Leptocylindrus spp.​ Thalassiosira spp. (today’s featured micrograph, 200x phase contrast) is a type of ​​phytoplankton belonging to the centric diatom group. This photosynthetic species grows primarily in marine waters. Some species within the genus are found in estuaries and aquatic systems that have been impacted by human activities. They can be identified by their coin-like shape.

March 3 – 9, 2024

Due to winter temperatures and weather conditions, boating activities were temporarily halted during the months of December 2023, January 2024, and February 2024. The safety of the crew as well as the boat are of the utmost concern at NBC.  Whether it’s slipping on an icy dock or slipping on the boat decking, we don’t want injuries that can be avoided.  Although staff wear appropriate gear during colder months, there is great risk to the life and health of crew if they were to slip and fall into the freezing waters during winter months.  Staff have been evaluating conditions on a week-to-week basis and are pleased to announce that Nutrient Sampling was able to be conducted on March 6th.  Staff are excited to resume boating activities and we are hopeful that favorable conditions continue throughout March.  Below is a table showing the bay sites sampled. ​

March 6, 2024

​Nutrient samples were collected from fourteen river stations and eight bay stations on March 6th. Edgewood Shoal was sampled at the surface and bottom; all other bay stations were sampled at the surface only. In the five days prior to sampling, there were 3.16 inches of precipitation recorded at T.F. Green. 

Among the river stations sampled, the highest total nitrogen (TN), total dissolved nitrogen (TDN), and dissolved inorganic nitrogen (DIN) concentrations were observed at Ten Mile River @ Central Ave. (TN = 1,500 ppb, TDN = 1,460 ppb, DIN = 1,304 ppb). The lowest TN, TDN, and DIN were observed at Coles River @ Milford Road (TN = 512 ppb, TDN = 462 ppb, DIN = 166 ppb).

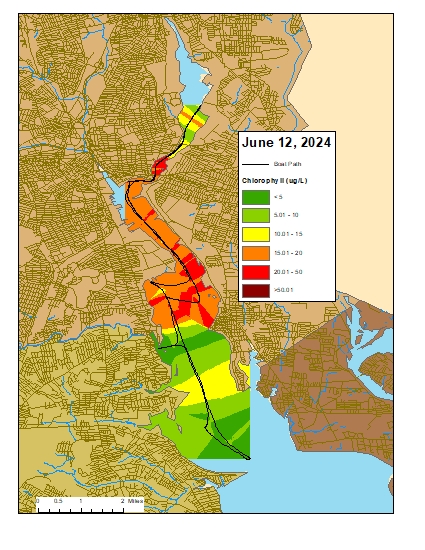
Among the bay stations sampled, the highest surface TN, TDN, and DIN were observed at Phillipsdale Landing (TN = 1,250 ppb, TDN = 929 ppb, DIN=786 ppb). The lowest surface TN, TDN, and DIN were observed at Conimicut Point (TN = 786 ppb, TDN = 389 ppb, DIN=315 ppb. Chlorophyll a concentrations at the surface bay stations averaged 1.90 μg/L overall with a maximum of 4.83 μg/L at the Bullock Reach Buoy.

The next scheduled sampling date is March 20, 2024.

February 21, 2024

Nutrient samples were collected from seven river stations on February 21st. In the five days prior to sampling, there were 0.05 inches of precipitation recorded at T.F. Green. 

Among the stations sampled, the highest total nitrogen (TN), total dissolved nitrogen (TDN), and dissolved inorganic nitrogen (DIN) concentrations were observed at Pawtuxet River @ Broad St (TN = 1,280 ppb, TDN = 1,250 ppb, DIN = 1,100 ppb, average of duplicates). The lowest TN, TDN, and DIN were observed at Moshassuck River @ Higginson Ave. (TN = 722 ppb, TDN = 676 ppb, DIN = 561 ppb, average of duplicates).

The next scheduled sampling date is March 6, 2024.​

February 7, 2024

Nutrient samples were collected from 14 river stations on February 7th. There was no precipitation recorded at T.F. Green in the five days prior to sampling

Among the stations sampled, the highest total nitrogen (TN), total dissolved nitrogen (TDN), and dissolved inorganic nitrogen (DIN) concentrations were observed at Ten Mile River @ Central Ave (TN = 1,800 ppb, TDN = 1,840 ppb, DIN = 1,780 ppb). The lowest TN, TDN, and DIN were observed at Coles River @ Milford Rd (TN = 635 ppb, TDN = 582 ppb, DIN = 363 ppb).

The next scheduled sampling date is February 21, 2024.​

October 23, 2024

​Water clarity was measured at seven locations in the Providence River estuary on October 23, 2024. No precipitation was recorded at TF Green in the five days prior to the survey. Secchi depth averaged 5.0 meters. The lowest clarity this week (4.7 meters) was measured at Conimicut Point, while the greatest clarity (5.5 meters) was measured at Edgewood Yacht Club. There was no distinct north-to-south trend of water clarity among the sites this week. Overall, water clarity increased from the previous measurements (data collected October 17, 2024).

October 17, 2024

Water clarity was measured at seven locations in the Providence River and Seekonk River estuaries on October 17, 2024. 0.14 inches of precipitation were recorded at TF Green in the five days prior to the survey. Secchi depth averaged 3.6 meters. The lowest clarity this week (1.5 meters) was measured at Phillipsdale Landing, while the greatest clarity (4.4 meters) was measured at Bullock Reach Buoy. There was a general north-to-south trend of increasing water clarity among the sites this week. Overall, water clarity increased from the previous measurements (data collected October 9, 2024).​​

October 9, 2024

​Water clarity was measured at seven locations in the Providence River and Seekonk River estuaries on October 9, 2024. 0.81 inches of precipitation were recorded at TF Green in the five days prior to the survey. Secchi depth averaged 2.3 meters. The lowest clarity this week (1.2 meters) was measured at Phillipsdale Landing, while the greatest clarity (3.2 meters) was measured at Bullock Reach Buoy. There was a north-to-south trend of increasing water clarity among the sites this week.  Overall, water clarity increased from the previous measurements (data collected October 3, 2024).​

January 24, 2024

Nutrient samples were collected from seven river stations on January 24th. In the five days prior to sampling and the morning of, there were 0.2 inches of precipitation recorded at T.F. Green. 

Among the stations sampled, the highest total nitrogen (TN) and total dissolved nitrogen (TDN) concentrations were observed at Blackstone River @ Slater Mill (TN = 1,030 ppb, TDN = 961 ppb); the highest dissolved inorganic nitrogen (DIN) was at Blackstone River @ Stateline (850 ppb). The lowest TN, TDN, and DIN were observed at Moshassuck River @ Higginson Ave. (TN = 708 ppb, TDN = 656 ppb, DIN = 524 ppb).

The next scheduled sampling date is February 7, 2024.​

October 3, 2024

​Water clarity was measured at seven locations in the Providence River and Seekonk River estuaries on October 3, 2024. No precipitation was recorded at TF Green in the five days prior to the survey. Secchi depth averaged 2.1 meters. The lowest clarity this week (0.7 meters) was measured at India Point Park, while the greatest clarity (3.5 meters) was measured at Conimicut Point. There was no strong directional gradient of water clarity among the sites this week.  Overall, water clarity decreased from the previous measurements (data collected September 25, 2024).​

Scroll to Top