October 30, 2024
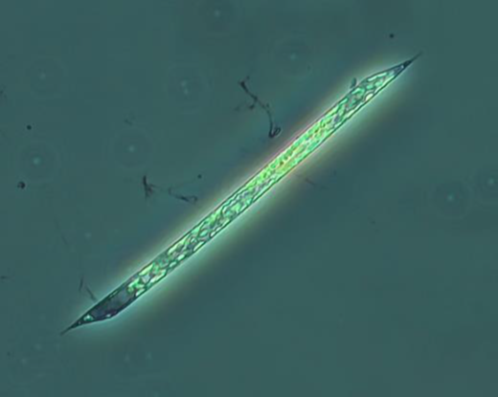
Phytoplankton samples were collected on October 30, 2024 at Bullock’s Reach and analyzed in the laboratory shortly after collection. Weather conditions and Sonde data were not recorded on this day. The qualitative tow net sample had a moderate filtration time. The filtrate was slightly cloudy with some golden brown particulates. The analysis of the quantitative whole water sample revealed a total of 260,000 cells/L. The microflagellates were found at 100,000 cells/L. The most predominant phytoplankton genera were Chaetoceros spp. at 104,000 cells/L, Leptocylindrus spp. at 26,000 cells/L, and Skeletonema spp. at 18,000 cells/L. Proboscia alata, shown here in a 100x phase contrast micrograph, is a solitary or chain-forming diatom that can measure up to 1mm in length. They are identified by the presence of a proboscis with a truncated tip and offset claspers. These diatoms are an oceanic, temperate water species and are sometimes found near the coast.