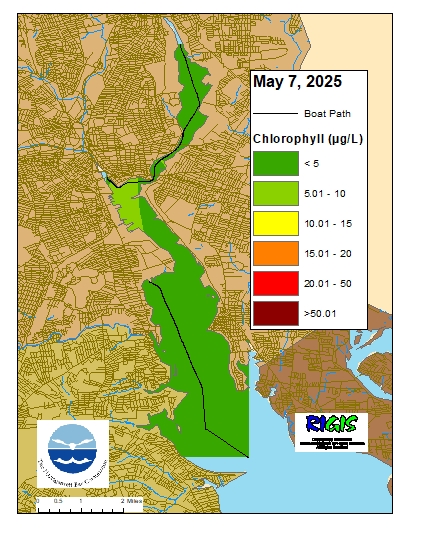
Surface chlorophyll data were collected on May 7, 2025, while the R/V Monitor was underway collecting nutrient samples in the Providence and Seekonk River estuary. The average chlorophyll concentrations were categorized as good in all areas surveyed. Overall, chlorophyll ranged from 1.78 µg/L to 8.30 µg/L with an average of 3.46 µg/L. The chlorophyll concentrations from this date are presented in the map below using Inverse Distance Weighting (IDW) interpolation.
The Narragansett Bay Commission will be conducting smoke testing investigations in the Providence/Cranston area on May 15. These investigations are being conducted to identify sources of extraneous water that discharge into its sanitary sewers.
The testing involves blowing white smoke into the sanitary sewer lines in the street and observing/recording where the smoke leaks out. The smoke is harmless, odorless, non-staining, and leaves no residue. A Material Safety Data Sheet can be provided upon request. The smoke will not enter your house or building unless there are defects in your sanitary plumbing.
Although unlikely, should smoke enter your building, do not be alarmed. Simply open the windows, and then notify the EST Associates crew in the street at 617-212-6714 that smoke has entered your building. Please be assured that the smoke will disappear quickly. Prior to testing, you can reduce the chances of smoke entering your building by pouring about a gallon of water down each sink and flush each toilet in your home. This will allow water to fill each trap (bend in the piping under the fixture), which will in turn prevent the smoke from entering the building.
The smoke testing is being coordinated by the Narragansett Bay Commission’s engineering consultant, Tighe & Bond, and will be conducted by EST Associates, Inc. Representatives of these firms will carry photo identification and EST vehicles will be clearly labeled with the company name and phone number. Field crews will be on your street within the next week to perform this test on May 15, 2025. The hours for testing are between 8:00 AM and 5:00 PM. Monday through Friday. The Fire and Police Departments are being notified of the smoke testing work locations.
If you suffer from lung or respiratory ailments and have concerns, please contact EST at (781) 455-0003 and special arrangements will be made.
If you have any specific questions regarding the smoke testing please contact Bryan Weiner, PE, Project Manager for Tighe & Bond at (781) 708- 9846 or Michael Caruolo, PE, The Narragansett Bay Commission at (401) 461-8848 x357. 0637.
On December 18th, 2024, fifteen stations were sampled for fecal coliform bacteria in the Providence and Seekonk Rivers; four of these stations were also sampled for enterococci bacteria. Further sampling was planned for the day in the Seekonk River, but was omitted due to weather issues. In the five days prior to sampling, 0.46” of precipitation was recorded at TF Green.
Fecal coliform counts were higher in the Providence River, compared to the previous sampling on November 20th (geometric mean of 91 MPN/100 mL compared to 9 MPN/100 mL on 11/20). The maximum count (430 MPN/100 mL) was measured at the Save the Bay sampling location.
Only one fecal coliform sample was analyzed from the Seekonk River, with a fecal coliform count of 43 MPN/100mL at Crook Point. This is higher than the geometric mean from samples taken on November 20th (14 MPN/100 mL), but may not be representative of the Seekonk River as a whole.
Enterococci results had an overall geometric mean of 66 MPN/100 mL. Enterococci counts ranged from 37 MPN/100 mL at Conimicut Point (geometric mean of two samples) to 121 MPN/100 mL at Point St. Bridge.
The next scheduled sampling date is January 2.
The table below lists the Rhode Island bacteria standards for primary contact and shellfishing established by the Rhode Island Department of Environmental Management (RIDEM). RIDEM defines primary contact as any recreational activities in which there is prolonged and intimate contact with water, involving considerable risk of ingesting water (e.g., swimming, diving, water skiing and surfing). Please note that the RIDEM bacteria standards are provided here for informational purposes only and are not intended to indicate official state compliance with primary contact or shellfishing standards.
Summary of Rhode Island Bacteria Standards for Saltwater Primary Contact and Shellfishing
Geometric mean ≤35 colonies/100 mL All samples ≤104 colonies/100 mL2
Shellfishing
Geometric mean ≤14 MPN/100 mL <10% of samples >49 MPN/100 mL3
NO ENTEROCOCCI CRITERIA
1Fecal coliform primary contact criteria applied only when adequate enterococci data are not available; 2Single sample maximum criterion for determining beach swimming advisories at designated beaches as evaluated by the Rhode Island Department of Health; 3For a three-tube decimal dilution.
Data Stream was deployed to conduct routine bay bacteria sampling on a beautiful April Spring Day. The temperature was 60°F and there was a slight breeze with no precipitation. While navigating up the Seekonk River to the next monitoring station, the crew got a close-up view of the ongoing demolition work of the Washington Bridge. Below is a picture of the remnants of the bridge
Phytoplankton samples were collected on March 19, 2025 at Bullock Reach and analyzed in the laboratory shortly after collection.
It was sunny and cold on this day. The water temperature was 6.6 degrees Celsius, and jellyfish were observed. Sonde data was not recorded.
The qualitative tow net sample had a moderate to long filtration time and the filtrate was cloudy and dark brown with a large amount of sediment.
The analysis of the quantitative whole water sample revealed a total of 4,744,000 cells/L. The microflagellates were found at 86,000 cells/L. The most predominant phytoplankton genera were Leptocylindrus spp. at 2,918,000 cells/L, Chaetoceros spp. at 1,474,000 cells/L, and Skeletonema spp. at 144,000 cells/L.
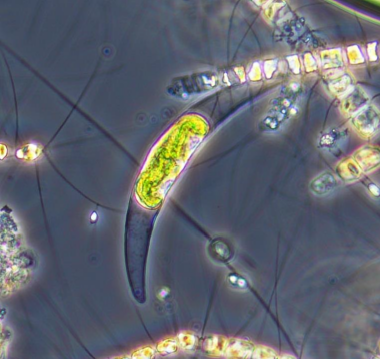
200x phase contrast micrograph of Pyrocystis spp.
Pyrocystis spp., shown here in a 200x phase contrast micrograph, are non-motile, tropical, epipelagic marine dinoflagellates. They exhibit bioluminescence, which means emitting light through a chemical reaction, when they are disturbed or agitated. This is an unusual defense mechanism against predation which aims to startle grazers who would otherwise eat them.
Phytoplankton samples were collected on November 14, 2024 at Bullock Reach and analyzed in the laboratory shortly after collection.
It was partly sunny, windy and cold on this day. Sonde data was not recorded.
The qualitative tow net sample had a quick filtration time and the filtrate contained some light brown particulates and plant matter.
The analysis of the quantitative whole water sample revealed a total of 288,000 cells/L. The microflagellates were found at 30,000 cells/L. The most predominant phytoplankton genera were Chaetoceros spp. at 34,000 cells/L, Leptocylindrus spp. at 76,000 cells/L, and Heterocapsa spp. at 26,000 cells/L.
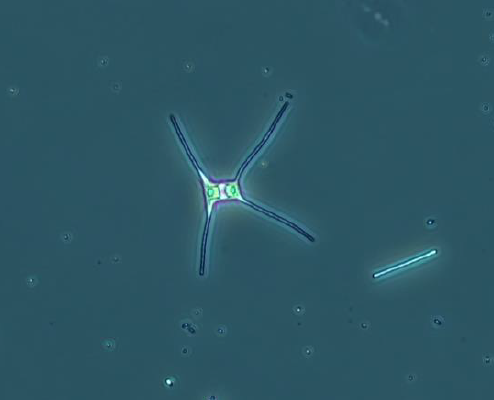
200x phase contrast micrograph of Staurastrum spp.
Staurastrum, shown here in a 200x phase contrast micrograph, is a large genus of microscopic green algae which are closely related to land plants. They are found in freshwater habitats around the world and live primarily in acidic lakes, ponds and swamps with low nutrient levels. Many Staurastrum species serve as indicators of eutrophic conditions.
Nutrient samples were collected from six river stations on February 19th. No samples were collected from bay stations due to adverse weather conditions. In the five days prior to sampling, 1.98 inches of precipitation were recorded at T.F. Green.
The highest total nitrogen (TN), total dissolved nitrogen (TDN) and dissolved inorganic nitrogen (DIN) concentrations were observed at Blackstone River @ Slater Mill (TN = 1,810 ppb, TDN = 1,960 ppb, DIN = 1,533 ppb). The lowest TN, TDN and DIN concentrations were observed at Woonasquatucket River @ Manton Ave. Bridge (TN =625 ppb, TDN = 711 ppb, DIN = 480 ppb).
The next scheduled sampling date is March 5, 2025.
Nutrient samples were collected from twelve river stations on February 5th. No samples were collected from bay stations due to adverse weather conditions. In the five days prior to sampling, 0.74 inches of precipitation were recorded at T.F. Green.
The highest total nitrogen (TN), total dissolved nitrogen (TDN) and dissolved inorganic nitrogen (DIN) concentrations were observed at Ten Mile River @ Central Ave. (TN = 3,160 ppb, TDN = 3,890 ppb, DIN = 3,148 ppb). The lowest TN, TDN and DIN concentrations were observed at Coles River @ Milford Rd. (TN =663 ppb, TDN = 727 ppb, DIN = 289 ppb).
The next scheduled sampling date is February 19, 2025.
Narragansett Bay Commission Offers Free Clean Water Tours: Follow the Flush!
In celebration of Rhode Island Clean Water Week, the Narragansett Bay Commission (NBC) will offer free public tours of its award-winning Field’s Point Wastewater Treatment Facility in Providence on Saturday, April 12 from 10:00 AM to 1:00 PM.
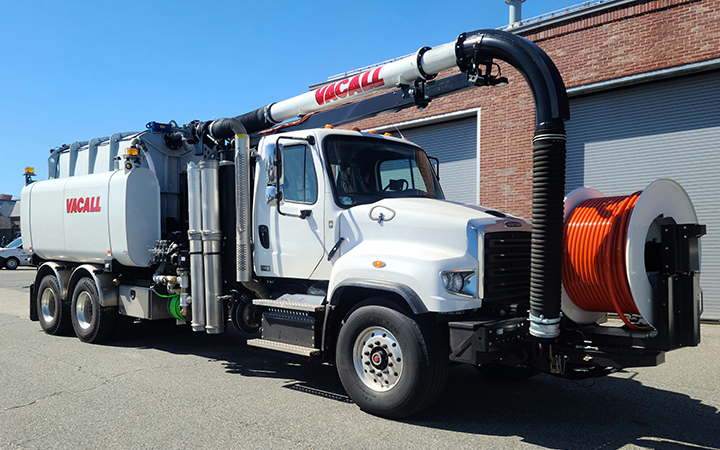
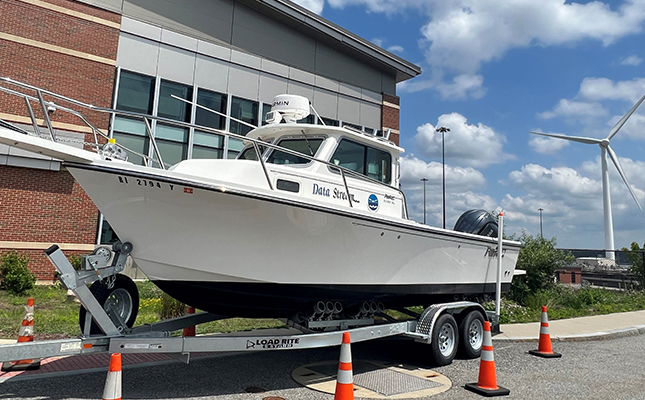
The tours will include a look at the region’s most sophisticated water quality lab, “touch-a-truck” and “touch-a-boat” with the NBC’s maintenance and research vehicles, a clean water scavenger hunt, and other fun activities.
“This facility is simultaneously one of the oldest and most advanced clean water facilities in the nation,” said NBC Chairman Vincent Mesolella. “We’re so excited to give the public the opportunity to ‘follow the flush’ and view the process that has made Narragansett Bay cleaner than it has been in 150 years.”
In addition, the NBC will issue certificates of completion to all students who take the tour that may be redeemed for extra credit at school (but students are advised check with their teacher first).
“I am confident that anyone who experiences this tour will be amazed and appreciative by the clean water efforts in our community,” Mesolella added.
Members of the public can book a tour on the half hours between 10:00 AM and 1:00 PM by emailing nbcpr@narrabay.com. Spaces are limited. The tour will take approximately 90 minutes.
The NBC joins four other clean water agencies in Rhode Island offering free public tours during Rhode Island Clean Water Week. Information on other tours is available at ricwa.org
The Narragansett Bay Commission (NBC) is proud to sponsor its 32nd annual student poster contest. The theme of this year’s contest is The Best Day I Had With Water. The NBC would like students to artistically showcase a day they remember having a great time with water. There are so many activities that involve water. Students could draw themselves at a beach, a water park, in a canoe, using their own pool, or even enjoying a drink of water after a grueling sports activity. Water helps us daily, let’s celebrate it!
The contest rules are as follows:
Students must be in grades K-6 and reside in Providence, North Providence, Johnston, Central Falls, Lincoln, Pawtucket, Cumberland, Cranston, Smithfield, or East Providence.
Posters cannot be larger than 11×17 or smaller than 8 1/2×11.
Posters must include the student’s name, grade, school, home address, and phone number on the back.
Posters become the property of the Narragansett Bay Commission.
Winners receive a $100 cash prize, winning posters are printed in NBC’s 2026 poster calendar, and winners are invited to a recognition ceremony at the NBC Field’s Point Wastewater Treatment Facility at 2 Ernest Street, Providence.
Mail posters to the Narragansett Bay Commission’s Public Affairs Office at One Service Road, Providence, RI 02905.
THE CONTEST DEADLINE IS FRIDAY, MAY 2, 2025!
For more information, please call the NBC’s Public Affairs Office at 401-443-4947 or email cmorissette@narrabay.com.