Tara Franey

October 1, 2025

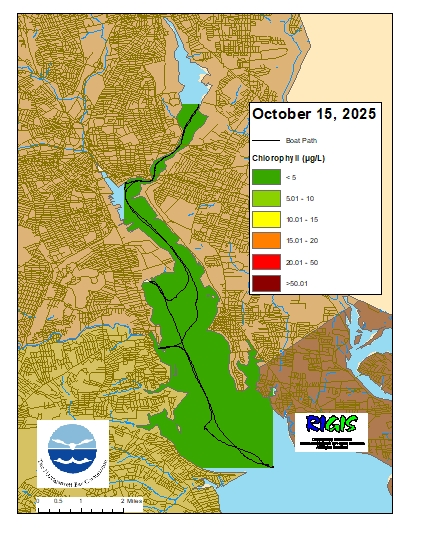
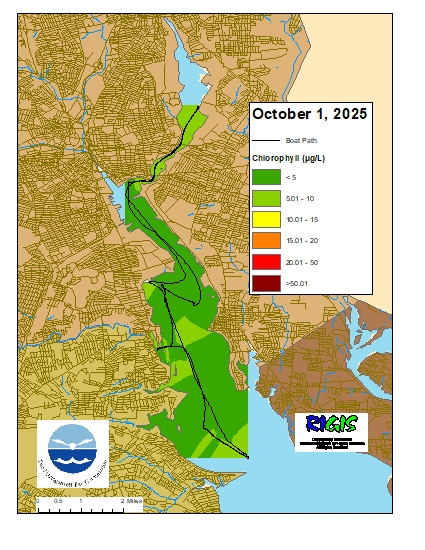
Surface chlorophyll data were collected on October 1, 2025, while the R/V Monitor was underway collecting nutrient samples in the Providence and Seekonk River estuary. The average chlorophyll concentrations were categorized as fair in the Seekonk River, and as good in all other areas. The average chlorophyll concentrations were categorized as good over all areas surveyed. Overall, chlorophyll ranged from 2.07 µg/L to 10.16 µg/L with an average of 4.94 µg/L. The chlorophyll concentrations from this date are presented in the map below using Inverse Distance Weighting (IDW) interpolation. 
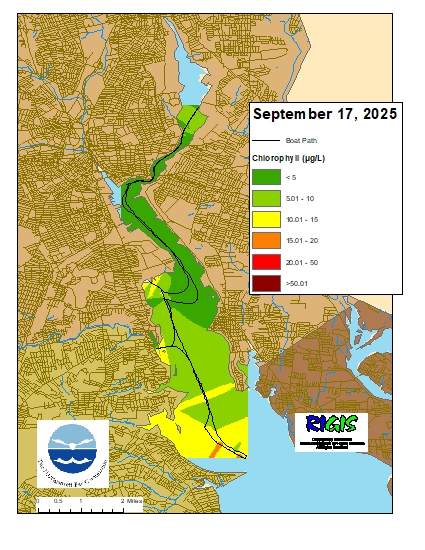
September 17, 2025

Surface chlorophyll data were collected on September 17, 2025, while the R/V Monitor was underway collecting nutrient samples in the Providence and Seekonk River estuary. The average chlorophyll concentrations were categorized as good in the Northern Providence River Channel and the Seekonk River, and as fair in all other areas. The average chlorophyll concentrations were categorized as fair over all areas surveyed. Overall, chlorophyll ranged from 0.98 µg/L to 20.49 µg/L with an average of 6.73 µg/L. The chlorophyll concentrations from this date are presented in the map below using Inverse Distance Weighting (IDW) interpolation. 

August 20, 2025

Nutrient samples were collected from six river stations and seven bay stations on August 20th. All bay stations were sampled at the surface and bottom. In the five days prior to sampling, 0.01” of precipitation were recorded at T.F. Green. 

Among the river stations sampled, the highest total nitrogen (TN), total dissolved nitrogen (TDN), and dissolved inorganic nitrogen (DIN) were observed at Pawtuxet River @ Broad St. (TN = 1,600 ppb, TDN = 1,650 ppb, DIN = 1,327.2 ppb). The lowest TN, TDN, and DIN were observed at Moshassuck River @ Higginson Ave (TN = 674 ppb, TDN = 801 ppb, DIN = 629.8 ppb).

Among the bay stations sampled, the highest surface TN was observed at Phillipsdale Landing (1,460 ppb). The highest TDN and DIN were observed at Pawtuxet Cove (TDN = 1,090 ppb, DIN = 796). The lowest surface TN and TDN were observed at Conimicut Point (TN = 482 ppb, TDN = 130 ppb). The lowest surface DIN was observed at four of the seven bay stations (13 ppb, reflecting minimum detection limits for DIN).

The next scheduled sampling date is September 3rd, 2025.​

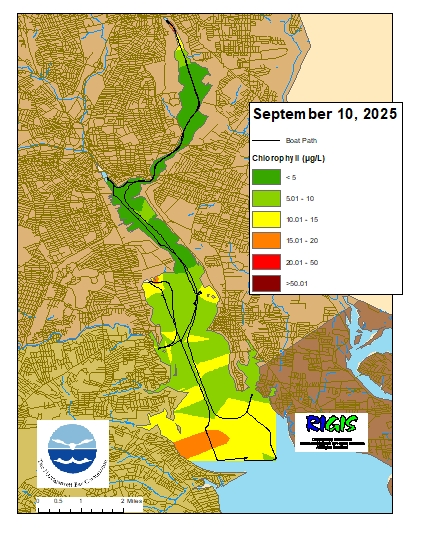
September 10, 2025

Surface chlorophyll data were collected on September 10, 2025, while the R/V Monitor was underway collecting nutrient samples in the Providence and Seekonk River estuary. The average chlorophyll concentrations were categorized as good in the Northern Providence River Channel and the Seekonk River, and as fair in all other areas. The average chlorophyll concentrations were categorized as fair over all areas surveyed. Overall, chlorophyll ranged from 1.34 µg/L to 36.38 µg/L with an average of 6.79 µg/L. The chlorophyll concentrations from this date are presented in the map below using Inverse Distance Weighting (IDW) interpolation. 
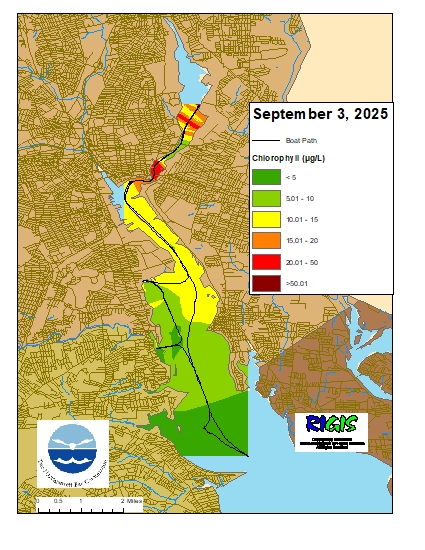
September 3, 2025

Surface chlorophyll data were collected on September 3, 2025, while the R/V Monitor was underway collecting nutrient samples in the Providence and Seekonk River estuary. The average chlorophyll concentrations were categorized as good in the Southern Providence River Channel, poor in the Seekonk River, and as fair in all other areas. The average chlorophyll concentrations were categorized as fair over all areas surveyed. Overall, chlorophyll ranged from 2.31 µg/L to 38.36 µg/L with an average of 11.11 µg/L. The chlorophyll concentrations from this date are presented in the map below using Inverse Distance Weighting (IDW) interpolation. 
August 27, 2025

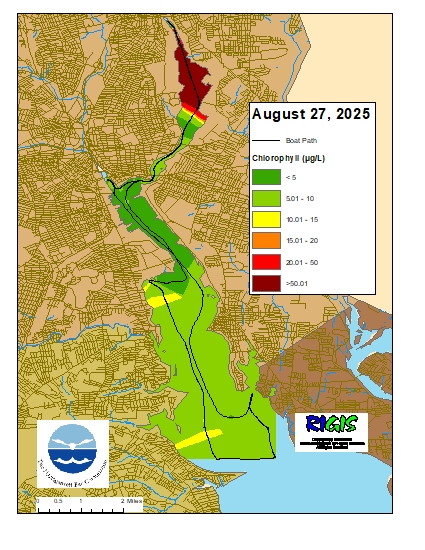
Surface chlorophyll data were collected on August 27, 2025, while the R/V Monitor was underway collecting nutrient samples in the Providence and Seekonk River estuary. The average chlorophyll concentrations were categorized as good in the Northern Providence River Channel, poor in the Seekonk River, and as fair in all other areas. The average chlorophyll concentrations were categorized as poor over all areas surveyed. Overall, chlorophyll ranged from 1.43 µg/L to 610.7 µg/L with an average of 30.00 µg/L. The chlorophyll concentrations from this date are presented in the map below using Inverse Distance Weighting (IDW) interpolation. 
August 13, 2025

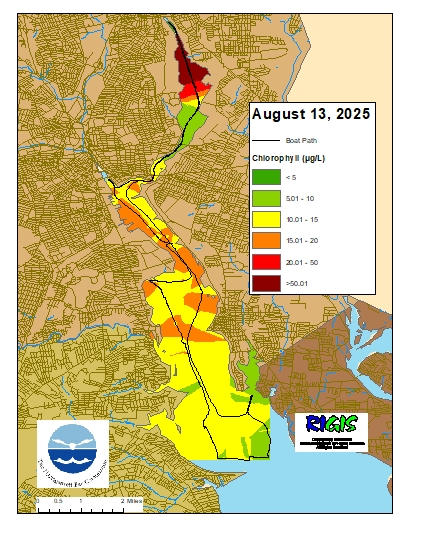
Surface chlorophyll data were collected on August 13, 2025, while the R/V Monitor was underway collecting nutrient samples in the Providence and Seekonk River estuary. The average chlorophyll concentrations were categorized as poor in the Seekonk River, and as fair in all other areas. The average chlorophyll concentrations were categorized as poor over all areas surveyed. Overall, chlorophyll ranged from 2.01 µg/L to 610.0 µg/L with an average of 21.56 µg/L. The chlorophyll concentrations from this date are presented in the map below using Inverse Distance Weighting (IDW) interpolation. 
August 6, 2025

Nutrient samples were collected from thirteen river on August 6th. In the five days prior to sampling, 0.46 inches of precipitation were recorded at T.F. Green. 

Among the river stations sampled, the highest total nitrogen (TN) was observed at Pawtuxet River @ Broad St. (1,450 ppb). The highest total dissolved nitrogen (TDN) and dissolved inorganic nitrogen (DIN) were observed at Ten Mile River @ Central Ave. (TDN = 1,315 ppb, DIN = 1,058.8 ppb, averages of duplicates). The lowest TN was observed at Runnins River @ River Rd. (386 ppb), and the lowest TDN was observed at Taunton River @ Berkley Bridge (303 ppb). The lowest DIN was observed at Palmer River @ Rt. 6 (13 ppb, reflecting minimum detection limits for DIN).

The next scheduled sampling date is August 20th, 2025.​

July 23, 2025

Nutrient samples were collected from seven river stations and seven bay stations on July 23rd. All bay stations were sampled at the surface and bottom. In the five days prior to sampling, trace amounts of precipitation were recorded at T.F. Green. 

Among the river stations sampled, the highest total nitrogen (TN), total dissolved nitrogen (TDN), and dissolved inorganic nitrogen (DIN) were observed at Pawtuxet River @ Broad St. (TN = 1,430 ppb, TDN = 1,390 ppb, DIN = 1,222.9 ppb). The lowest TN, TDN, and DIN were observed at Blackstone River @ Bikepath Bridge (TN = 789 ppb, TDN = 794 ppb, DIN = 509.5 ppb).

Among the bay stations sampled, the highest surface TN, TDN, and DIN were observed at Pawtuxet Cover (TN = 1,200 ppb, TDN = 838 ppb, DIN = 628.6 ppb). The lowest surface TN and TDN were observed at Edgewood Yacht Club (TN = 493 ppb, TDN = 195 ppb). The lowest surface DIN was observed at four of the seven bay stations (13 ppb, reflecting minimum detection limits for DIN).

The next scheduled sampling date is August 6th, 2025.​

July 8, 2025

Nutrient samples were collected from thirteen river stations and eight bay stations on July 8th. All bay stations were sampled at the surface; Edgewood Shoals was sampled at the surface and bottom. In the five days prior to sampling, there were 0.55 inches of  precipitation recorded at T.F. Green. 

Among the river stations sampled, the highest total nitrogen (TN), total dissolved nitrogen (TDN), and dissolved inorganic nitrogen (DIN) were observed at Pawtuxet River @ Broad St. (TN = 1,360 ppb, TDN = 1,350 ppb, DIN = 1,044.4 ppb). The lowest TN was observed at Runnings River @ River Rd. (617 ppb). The lowest TDN and DIN were observed at Palmer River @ Rt. 6 (TDN = 374 ppb, DIN = 21.3 ppb).

Among the bay stations sampled, the highest surface TN and TDN were observed at Phillipsdale Landing (TN = 1,200 ppb, TDN = 509 ppb). The highest DIN was observed at Pawtuxet Cove (189 ppb). The lowest surface TN and TDN were observed at Conimicut Point (TN = 538 ppb, TDN = 164 ppb). The lowest surface DIN was observed at Conimicut Point and India Point Park (13 ppb, reflecting minimum detection limits for DIN).

The next scheduled sampling date is July 23rd, 2025.​

Scroll to Top