Nutrient samples were collected from one bay station and seven local river stations on February 8th, 2023. Bay station Phillipsdale Landing was sampled at the surface and the bottom. In the five days prior to sampling, 0.05 inches of rainfall was recorded at T.F. Green.
Among the river stations sampled, the highest total nitrogen (TN), total dissolved nitrogen (TDN), and dissolved inorganic nitrogen (DIN) were observed at Ten Mile River at Roger Williams Ave. The TN, TDN, and DIN were 2,310 ppb, 2,370 ppb, and 2,023.9 ppb respectively. The lowest TN, TDN, and DIN were observed in the duplicates at Moshassuck River at Higginson Ave. The TN, TDN, and DIN were averaging 877 ppb, 878 ppb, and 740.6 ppb, respectively.
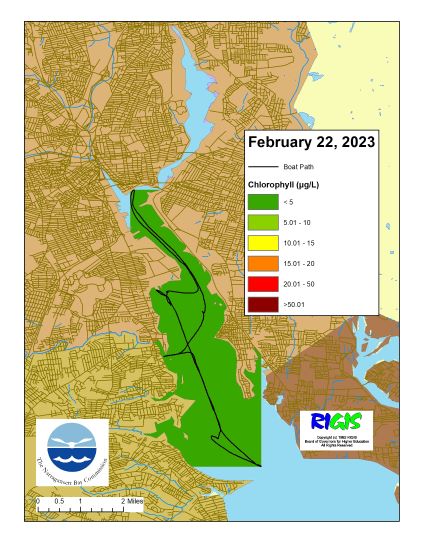
The Phillipsdale Landing station had TN, TDN, and DIN concentrations of 1,500 ppb, 1,350 ppb, and 1,142 ppb, respectively. Chlorophyll a concentration has decreased at Phillipsdale Landing (0.566 ug/L) since it was last sampled in January. The maximum result (10.65 ug/L) occurred at Bullock Reach Buoy.
Data from additional sampling dates (typically every two weeks) are pending analysis and writeup.