May 28-June 3, 2023
Phillipsdale Landing
Overall, water quality at Phillipsdale Landing was fair to good. Weather conditions were dry this week, with only a very light rain of 0.02 inches recorded at T.F. Green. Blackstone River flow continued its declined over the course of the week from the increase in flow last week on May 20th. Surface salinity averaged 9.2 ppt and ranged from 3.3 ppt to 21.8 ppt. At the bottom, salinity averaged 21.0 ppt and ranged from 4.4 ppt to 27.6 ppt. Temperatures increased this week, averaging 20.2°C at the surface and ranging 16.5°C – 23.6°C. At the bottom, temperatures averaged 17.6°C and ranged 15.1°C –21.0°C.
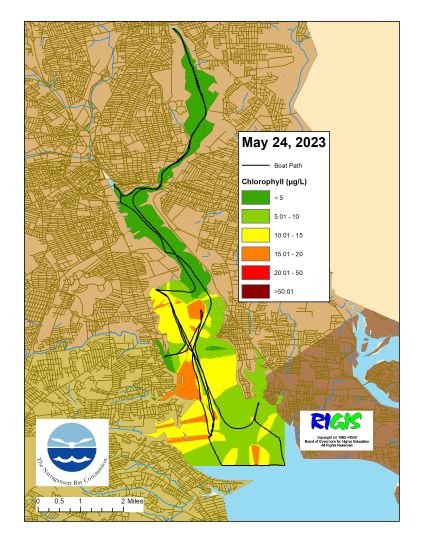
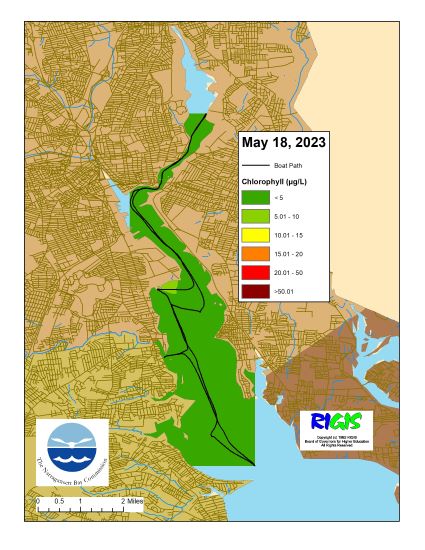
Dissolved oxygen (DO) at Phillipsdale Landing remained above the hypoxia threshold of 2.9 mg/L at the surface. DO dropped below the hypoxia threshold at the bottom intermittently through May 28th to May 31st. Surface DO increased from the previous week, averaging 10.3 mg/L and ranging 6.0-17.5 mg/L. Bottom water DO concentration averaged 4.9 mg/L and ranged from 1.9 mg/L to 11.3 mg/L. Chlorophyll readings increased from last week, averaging 18.9 ug/L at the surface and 18.4 ug/L at the bottom. Maximum chlorophyll at the surface reached 58.2 ug/L in the afternoon of May 31st. Please note that tidal fluctuations and Blackstone River flows greatly influence water column salinity, temperature, and DO at this location. Also, please note that an isolated portion of suspect chlorophyll data from May 29th was excluded from the summary.
Bullock Reach
Bullock Reach sondes was deployed on June 1st for the season. Please note that due to the technical difficulties which occurred on June 1st during set up and the week ending on June 3rd, this post is based on a very limited Bullock Reach data set. Overall, water quality was good at Bullock Reach this week. Salinity averaged 24.1 ppt, 25.8 ppt, and 30.0 ppt at the surface, middle, and bottom sondes, respectively. Surface salinity ranged 21.3-26.2 ppt, mid salinity ranged 22.0-29.0 ppt, and bottom salinity ranged 28.2-31.1 ppt. Surface temperature averaged 20.1°C and ranged from 16.9°C to 21.9°C. Mid temperatures averaged 19.2°C and ranged from 16.7°C to 21.3°C. Bottom temperatures averaged 15.1°C and ranged from 13.6°C to 17.1°C.
DO concentrations at Bullock Reach remained above the hypoxia threshold all week. Surface DO averaged 8.6 mg/L and ranged 7.2 – 10.4 mg/L. In the mid waters, DO averaged 7.7 mg/L and ranged 5.9 – 9.1 mg/L. At the bottom, DO averaged 5.3 mg/L and ranged 4.6– 6.5 mg/L. Chlorophyll concentrations were low, averaged 7.4 ug/L, 8.6 ug/L, and 2.3 ug/L at the surface, mid, and bottom waters, respectively. The maximum surface chlorophyll of 11.6 ug/L was during the morning of June 3rd.